Types of Family Structures: Nuclear, Extended, Blended, Single-Parent and More
The main types of family structures are nuclear families (two parents and their children), single-parent families, extended families (parents and children living with other relatives), blended families or stepfamilies, and families formed through adoption, foster care or kinship care. Sociologists also count childless couples, cohabiting couples, same-sex couple families, multigenerational households and, more loosely, "chosen families." Most real families move between several of these over a lifetime. This guide defines each one, shows how common it is in the US using Census Bureau and Pew Research data, and explains where each structure shows up when you draw it on a family chart.
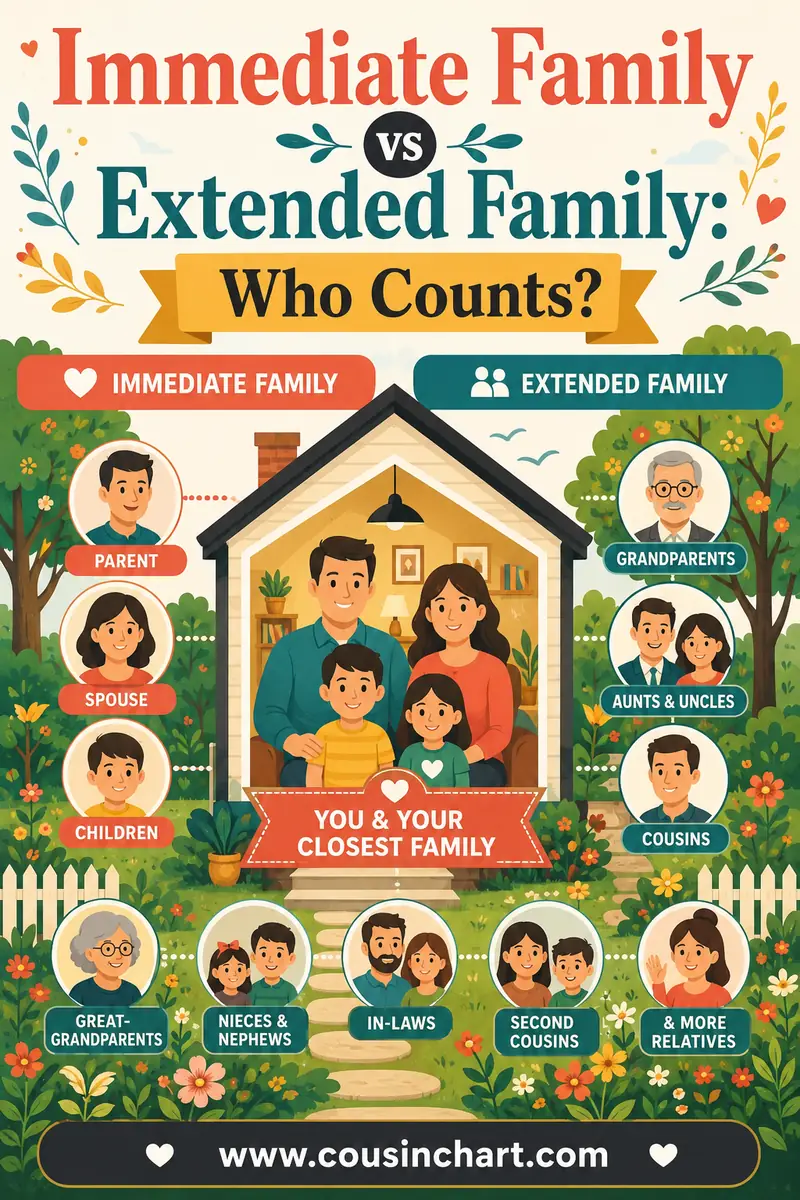
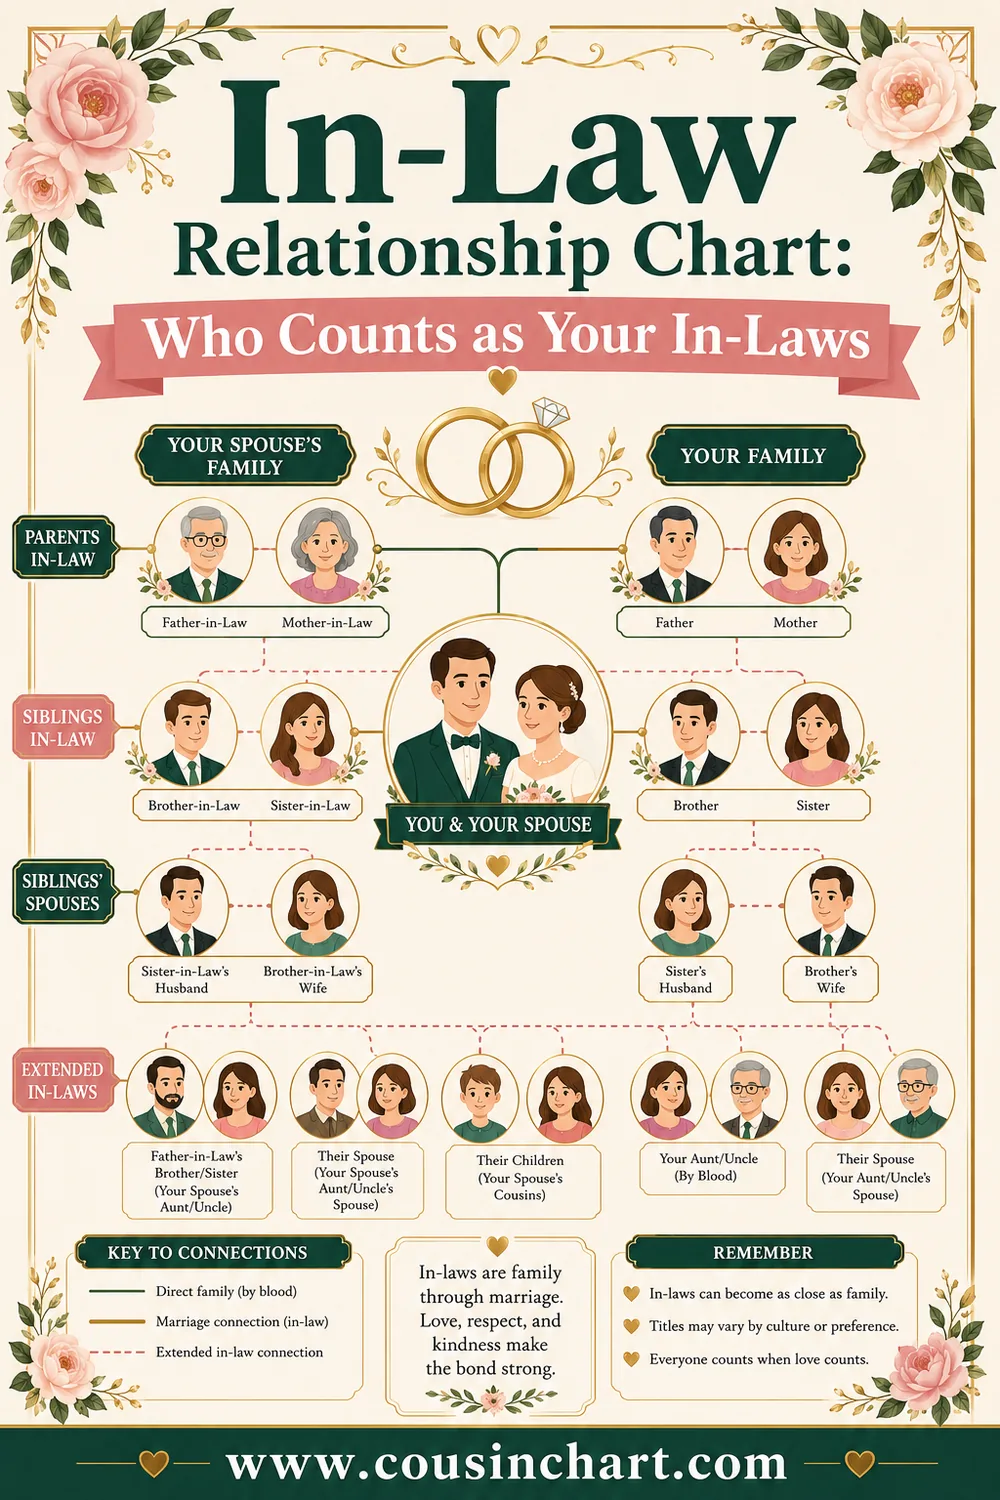
A quick word on how this page fits with the rest of the site. Our in-law relationship chart maps the relatives you gain through marriage, and immediate family vs. extended family settles who counts as close kin. This page steps back further and looks at the overall shape of a family: who lives together, who raises whom, and how those households are connected.
One note before we start: no family structure on this list is "the right one." Sociologists describe structures; they don't rank them. Families of every type raise happy, healthy kids.
Quick check. Tap a question for the short answer:
Types of Family Structures at a Glance
| Structure | Who's in it | Also called |
|---|---|---|
| Nuclear family | Two parents and their children in one household | Two-parent family, conjugal family |
| Single-parent family | One parent raising one or more children | Lone-parent family, one-parent family |
| Extended family | At least one parent and child plus other relatives, such as grandparents, aunts or cousins | Joint family (in some cultures) |
| Multigenerational household | Two or more adult generations, or grandparents with grandchildren | Three-generation home |
| Blended family / stepfamily | A couple where at least one partner has children from a previous relationship | Reconstituted or recombined family, bonus family |
| Adoptive family | Parents who have legally adopted one or more children | |
| Foster family | Caregivers temporarily raising children placed by a child welfare agency | Resource family |
| Kinship care family / grandfamily | Grandparents or other relatives raising children whose parents can't | Skipped-generation household |
| Childless or child-free couple | A married or partnered couple without children | |
| Cohabiting family | An unmarried couple living together, with or without children | Domestic partnership |
| Same-sex couple family | Two partners of the same sex, with or without children | |
| One-person household | An adult living alone | Single-person household |
| Chosen family | Close friends or mentors treated as family | Fictive kin |
The rest of this guide takes these one at a time. But first it helps to know how sociologists and the Census Bureau define "family" in the first place, because the definitions shape the statistics.
How Sociologists Define "Family"
The free OpenStax Introduction to Sociology textbook, published by Rice University, describes a family as a socially recognized group, usually joined by blood, marriage, cohabitation or adoption, that forms emotional bonds and works as an economic unit. Notice the word "usually." Sociologists care more about how people relate to each other than about a fixed checklist of roles.
Two more terms from the same chapter come up a lot:
- Family of orientation: the family you're born into (or raised in).
- Family of procreation: the family you form as an adult, through marriage or partnership and often children.
Most people belong to both over a lifetime. On a family tree, your family of orientation sits on the row above you, and your family of procreation sits on your row and below.
The public's idea of "family" is broader than any one structure, but it isn't unlimited. OpenStax reports that in a 2010 survey by Indiana University researchers, 99.8% of people agreed that a husband, wife and children make a family, while 92% said the same of a married couple without children, 83% of unmarried couples with children, and 39.6% of unmarried couples without children.
Family vs. household: the Census Bureau's definitions
Government statistics use stricter definitions, and it pays to know them before reading any numbers. The Census Bureau's Current Population Survey defines a family as two or more people related by birth, marriage or adoption who live together, one of whom is the householder. A household is everyone living in one housing unit, related or not. So:
- A married couple with kids is a family household.
- Two unrelated roommates form a nonfamily household.
- Someone living alone is also a nonfamily household.
- A young couple living in the wife's parents' home is a related subfamily inside her parents' family household.
The Census also defines a stepfamily as a married-couple household with at least one child under 18 who is the householder's stepchild, and notes that this definition may undercount stepfamilies. That's a useful reminder: official numbers capture households, not the full web of relationships that stretch between homes.
The Nuclear Family
A nuclear family is two parents and their children living together. The term "nuclear" comes from "nucleus," the core around which other relatives cluster. In the mid-20th century US, this was the most common arrangement for raising children, and it's still the single largest category today, though a smaller share than it once was.
Pew Research Center found that in 2014, 69% of US children lived with two parents, down from 87% in 1960. Only 46% lived with two parents who were both in their first marriage, compared with 73% in 1960. More recent Census figures show the share varies by a child's age: in 2023, 75% of children under 6 lived with two parents, compared with 68% of those ages 12 to 17.
A few variations still count as nuclear families:
- Two married parents in a first marriage.
- Two married parents where one or both were married before (Pew counted 15% of children in this group).
- Two unmarried, cohabiting parents (7% of children in Pew's figures).
- Two parents of the same sex.
- Two adoptive parents.
On a family chart: A nuclear family is the simplest unit to draw. Put the two parents side by side, connect them with a horizontal line, and drop a vertical line to a row of children. It's the building block every bigger chart repeats.
Extended and Multigenerational Families
OpenStax defines an extended family as a household that includes at least one parent and child plus other relatives, like grandparents, aunts, uncles and cousins. In many parts of the world, this is the most common arrangement, and in some cultures a large household of brothers, their wives and children is called a joint family.
In the US, a closely related idea is the multigenerational household. Pew defines it as a home with two or more adult generations (mostly adults 25 and older), or grandparents living with grandchildren under 25. By that definition, Pew found that 59.7 million Americans, or 18% of the population, lived in multigenerational homes in March 2021, up from 7% in 1971. The share was 26% among Black and Hispanic Americans, 24% among Asian Americans and 13% among white Americans.
Why do families live this way? Common reasons include sharing costs, caring for children or aging parents, cultural tradition, and young adults saving money. The Census Bureau found that in 2025, 58% of adults ages 18 to 24 lived in their parents' home, compared with 16% of adults ages 25 to 34.
On a family chart: The relationships are drawn the same way as on any tree. What changes is that you might add a note or shading to show who shares a household. Genograms (family diagrams used by therapists and social workers) often draw a dotted line around everyone living under one roof.
Single-Parent Families
A single-parent family is one parent raising children without a spouse or partner in the home. It can come about through divorce, separation, the death of a partner, having a child without a partner, or adopting as a single person.
Pew found that in 2014, 26% of US children lived with a single parent, up from 9% in 1960. About 83% of those children lived with their mother. OpenStax, citing later Pew work, notes that the share of children living with a single father rose from 1% in 1968 to 3% in 2008.
"Single-parent" describes the household, not the child's whole family. Many children in single-parent homes have a second parent who's very involved but lives elsewhere, and grandparents or other relatives who help a lot. That's why a family chart often tells a fuller story than a household count.
On a family chart: Both biological or legal parents still appear on the tree, connected to the child. If the parents were married and divorced, many charts mark the union line with a double slash. If they were never a couple, some charts show them without a union line at all. The household itself can be noted separately.
Blended Families and Stepfamilies
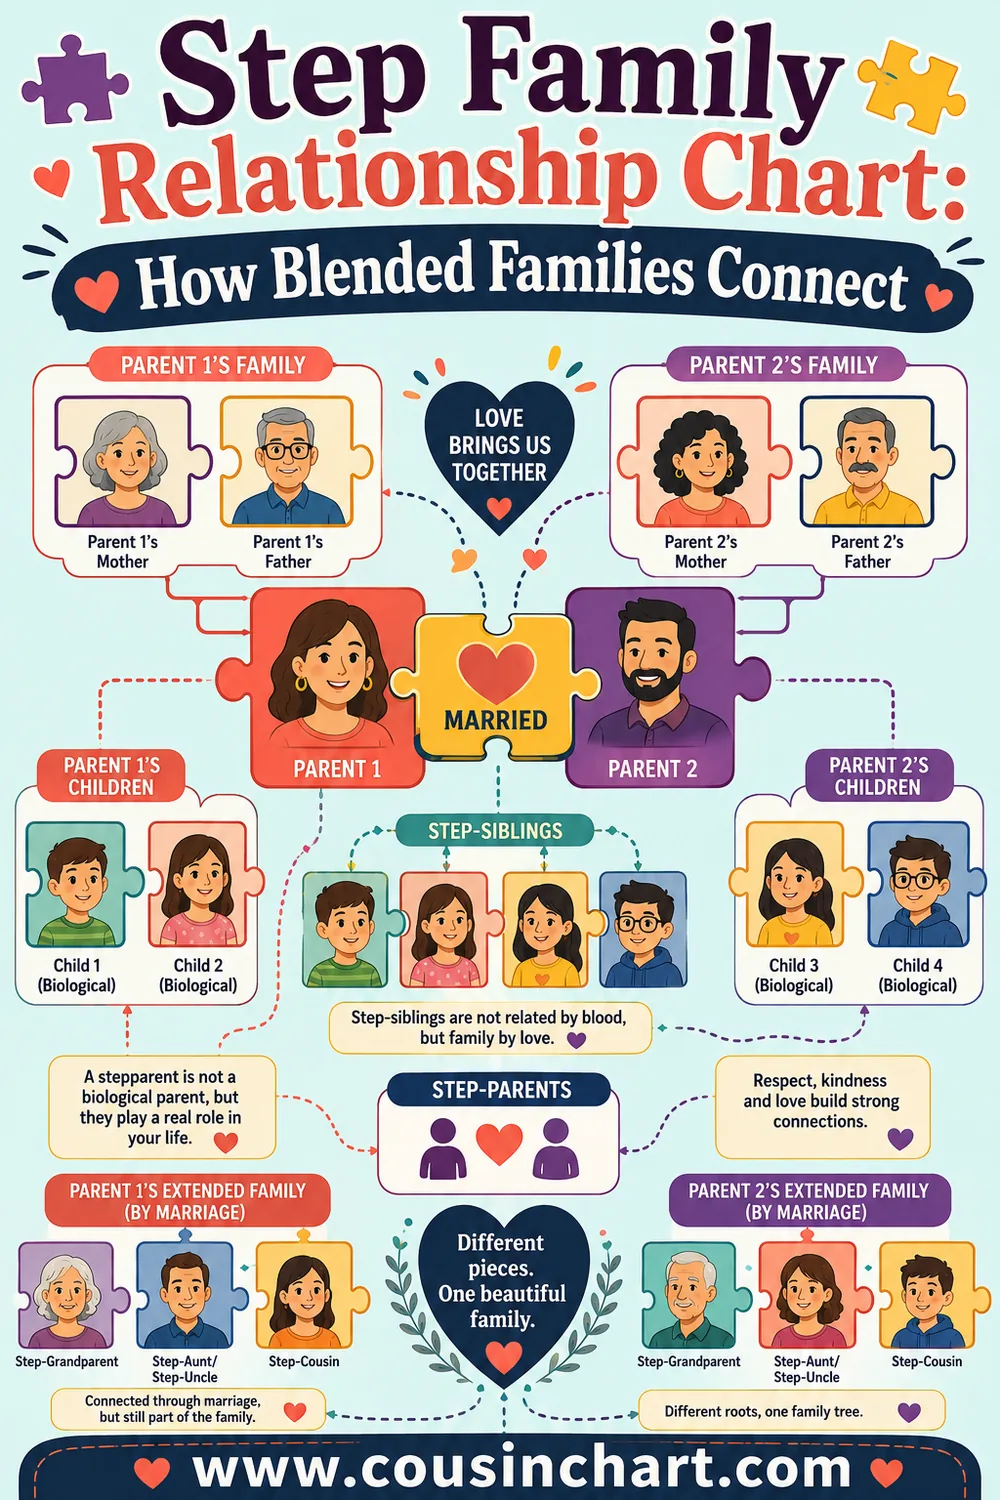
A blended family, also called a stepfamily or a recombined family, forms when a couple comes together and at least one partner already has children. Kids in blended families may have stepparents, stepsiblings and half-siblings, and many move between two households.
Pew found that 16% of children lived in blended families, a share that has been fairly stable since the early 1990s. About 8% lived with a stepparent, and 12% lived with stepsiblings or half-siblings.
The vocabulary matters here:
- A stepparent is your parent's spouse who isn't your parent.
- A stepsibling is your stepparent's child; you share no parent.
- A half-sibling shares one parent with you.
Our explainer on half-siblings vs. step-siblings covers that difference in detail, and the step family relationship chart names every step-relative from step-grandparents to step-cousins.
On a family chart: Blended families are the trickiest to draw. The rule genealogists follow is to draw each union separately: each marriage or partnership gets its own line, and each child descends from the specific pair who are their parents. Our blended family tree template walks through the layout.
Adoptive, Foster and Kinship Care Families
These three structures all involve children being raised by someone other than their birth parents, but they differ in how permanent and legal the arrangement is.
- Adoptive family: Adoption is a legal process that makes the adoptive parents the child's parents permanently, with all the same rights and responsibilities as birth parents.
- Foster family: Foster care is a temporary arrangement in which a child welfare agency places a child with licensed caregivers. The usual goal is to reunite the child with their family, though some foster children are later adopted.
- Kinship care: Grandparents, aunts, uncles, older siblings or close family friends raise a child whose parents can't. It may be informal, arranged through child welfare, or made permanent through guardianship or adoption.
Kinship care is more common than many people realize. OpenStax, citing federal child statistics, reports that in 2018 3 million children lived with a guardian who was neither a biological nor an adoptive parent. About half lived with grandparents and about 20% with other relatives. Pew's 2014 figures similarly found that 5% of children lived with no parent, most of them with grandparents.
Households where grandparents raise grandchildren without a parent present are sometimes called grandfamilies or skipped-generation households. Pew's multigenerational study found skipped-generation homes make up about 5% of multigenerational households.
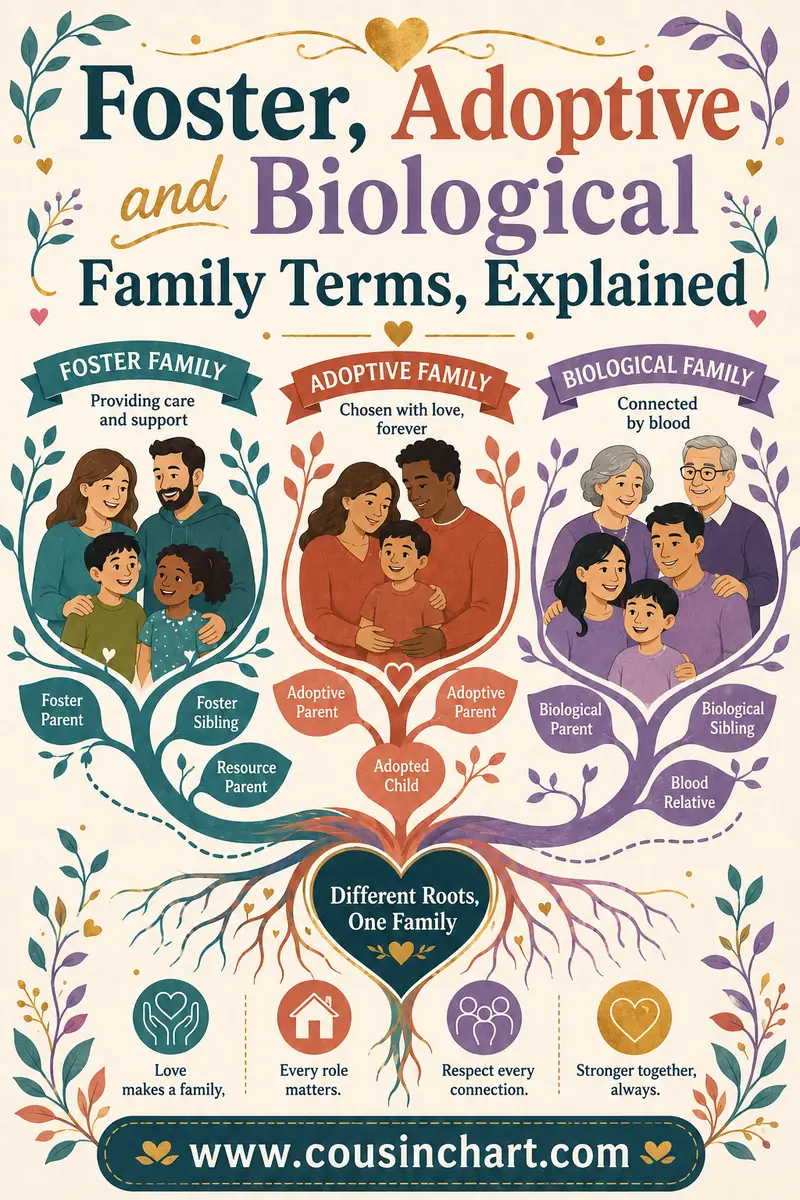
For the specific words these families use (birth mother, first family, resource parent, kinship caregiver), see our guide to foster and adoptive family terms, and for how relatives step in to raise children, our explainer on what kinship care is.
On a family chart: Genealogists usually show adoptive parents as the child's parents on the main tree, with a label or a dotted line, and may show birth parents with a different line style. Foster relationships are usually noted rather than drawn as parent lines, since they're often temporary. Kinship caregivers keep their biological relationship (grandmother, aunt) and gain a caregiver note.
Couples Without Children, Cohabiting and Same-Sex Couple Families
Not every family includes children, and not every couple is married. Sociologists count all of these as family structures.
Childless and child-free couples
A married or partnered couple without children is a family by the Census definition, since they're related by marriage and live together. Some couples choose not to have children (often called "child-free"); others can't or haven't yet. The Census Bureau found that in 2025, only 39% of families had their own children under 18 living at home, down from 54% in 1975. Part of that change reflects longer lives: many couples spend decades together after their kids have grown and moved out.
Cohabiting families
Cohabitation means living together as a couple without being married. It has grown a lot. The Census Bureau reports that about 3.2 million children lived with cohabiting parents in 2023, up from 2.2 million in 2007. OpenStax notes that in 2018, 15% of adults ages 25 to 34 lived with an unmarried partner.
Same-sex couple families
Same-sex couples may be married or cohabiting, with or without children. The US Supreme Court's 2015 decision in Obergefell v. Hodges made same-sex marriage legal nationwide. OpenStax, citing Census Bureau data, reports 594,000 same-sex couple households, and that 14% of same-sex couples had children under 18, compared with 38% of opposite-sex couples. The same chapter summarizes a review of 81 parenting studies that found no measurable advantage for children raised by opposite-sex parents.
Living alone
Strictly speaking, a person living alone isn't a "family household" by the Census definition, but they're still part of families: as someone's child, sibling, aunt or grandparent. They're also a fast-growing group. In 2025 there were 39.7 million one-person households, 29% of all households, up from 20% in 1975.
On a family chart: All of these appear like any other couple or individual. Cohabiting couples can be shown with a dashed union line if you want to distinguish them from marriages. Same-sex couples are drawn with the same union line as any couple. Most modern family tree software supports both.
Chosen Family and Fictive Kin
Many people have relatives who aren't related by blood, marriage or adoption at all: a godmother, a "play cousin," the neighbor everyone calls Auntie, or close friends who spend every holiday together. Sociologists call these relationships fictive kin. The word "fictive" doesn't mean fake. It means the kinship is created by social agreement rather than by birth or law.
"Chosen family" is a related term, often used by people who've built close family-like networks of friends, sometimes because their family of origin is distant or unsupportive. Our page on fictive kin covers how this works across cultures and when it becomes a legal category.
On a family chart: Fictive kin don't usually appear on a genealogical tree, which tracks blood, marriage and adoption. They do appear on genograms and "ecomaps," the diagrams therapists and social workers use, where close relationships are drawn regardless of how they formed.
Family Structures Across Cultures: Marriage, Descent and Residence
Household type is only one way to describe family structure. Sociologists and anthropologists also look at three other features, and these explain why family charts look so different around the world.
| Feature | Main types | What it means |
|---|---|---|
| Marriage pattern | Monogamy, polygamy | One spouse at a time, or more than one. OpenStax notes that in the regions where polygamy is most common, an average of 11% of people live in such arrangements. |
| Line of descent | Bilateral, patrilineal, matrilineal, ambilineal | Whether kinship is traced through both parents, the father's line, the mother's line, or either depending on the situation. |
| Residence after marriage | Patrilocal, matrilocal, neolocal | Whether a couple lives with or near the husband's family, the wife's family, or in a new home of their own. |
According to OpenStax, about 60% of societies, mostly modernized nations, follow bilateral descent, tracing kinship through both parents, while about 40% follow unilateral descent through one line. The US is bilateral: you're equally related to your mother's and father's families, even if your surname comes from one side.
These patterns shape family charts. In a patrilineal society, a family record might follow only sons' lines, so daughters' children appear on their husbands' family records instead. In a matrilineal one, the reverse is true. Neolocal residence, where couples set up a new household, is closely tied to the nuclear family pattern common in the US.
How American Family Structures Have Changed
Putting the numbers side by side shows how much the shape of US households has shifted over the past half century or more.
| Measure | Earlier | Recent | Source |
|---|---|---|---|
| Households that are married couples | 66% (1975) | 47% (2025) | Census Bureau |
| One-person households | 20% (1975) | 29% (2025) | Census Bureau |
| Families with own children under 18 at home | 54% (1975) | 39% (2025) | Census Bureau |
| Median age at first marriage (men / women) | 23.5 / 21.1 (1975) | 30.8 / 28.4 (2025) | Census Bureau |
| Children living with two parents | 87% (1960) | 69% (2014) | Pew Research Center |
| Children living with a single parent | 9% (1960) | 26% (2014) | Pew Research Center |
| Americans in multigenerational homes | 7% (1971) | 18% (2021) | Pew Research Center |
| Children living with cohabiting parents | 2.2 million (2007) | 3.2 million (2023) | Census Bureau |
A few patterns stand out. People are marrying later, more people live alone, and more live with several generations under one roof. Fewer children live with two parents in a first marriage, while the share in blended families has held fairly steady around 16% since the early 1990s.
Change doesn't mean decline. Families are adapting to longer lives, later marriages, higher housing costs and changing laws, and they're doing it in a lot of different shapes. Pew found in 2010 that 76% of adults called family the most important part of their lives, as OpenStax reports.
Where Each Family Structure Shows Up on a Family Chart
Different charts are built for different jobs, so each structure shows up differently depending on which one you're using.
| Structure | Pedigree chart (your ancestors) | Descendant or family tree | Genogram |
|---|---|---|---|
| Nuclear | Your two parents | One union line with children below | Couple line plus child lines; household circled |
| Single-parent | Both parents still shown | Both parents shown; union marked as divorced or absent | Household drawn around parent and kids |
| Extended / multigenerational | No change (ancestors are the same) | Same lines; add residence notes | Dotted boundary around everyone in the home |
| Blended / stepfamily | Biological or legal parents only | Separate union lines for each marriage | All unions shown, with step-ties |
| Adoptive | Adoptive parents, often noted; birth parents optional | Child linked to adoptive parents with a label | Adoption shown with dotted or labeled line |
| Foster | Not shown as parents | Usually a note | Foster placement shown with its own symbol |
| Kinship care | Biological parents shown | Caregiver keeps their kin role; note added | Caregiving relationship drawn to the child |
| Cohabiting / same-sex | Parents shown as usual | Union line (dashed if unmarried, if you wish) | Union line with relationship type |
| Chosen family | Not shown | Not usually shown | Drawn as close relationships |
Try it yourself: one family, many structures
Here's an illustrative example with made-up people to show how one family can include several structures at once.
Maria grew up in a nuclear family with her parents and brother. After college she lived alone for a few years (a one-person household), then moved in with her partner, Dev (a cohabiting couple). They married, and Dev's daughter from a previous relationship, Asha, lives with them half the week, so they're now a blended family. When Maria's widowed father moved in, the home became a multigenerational household. Later, when Maria's sister couldn't care for her son for a while, Maria and Dev took him in through kinship care.
On a family tree, almost none of that changes the lines: Maria is still her father's daughter, Asha is still Dev's daughter and Maria's stepdaughter, and the nephew is still Maria's nephew. What changes is the household, and that's what a genogram or a set of notes captures. It's a good reminder that "family structure" usually describes a moment in time, not a permanent label.
How to Describe Your Own Family Structure in Five Steps
Whether you're filling out a school project, starting a family tree or just curious, here's a simple way to name your family's structure. It works for any family, however it's put together.
- List everyone who lives in your home. Write each person's name and their relationship to you: parent, stepparent, sibling, grandparent, partner, cousin, foster sibling.
- Find the core unit. Is there a couple raising children together? One parent? A grandparent raising grandchildren? That core usually names the structure: nuclear, single-parent or kinship care.
- Add the extras. If other relatives live with you, add "extended" or "multigenerational." If one of the adults has children from an earlier relationship, add "blended."
- Note how children joined the family. Birth, adoption, foster placement and kinship care can all exist in the same home. Each child's path can be noted separately.
- Look beyond the front door. Many families stretch across two or more households, such as kids who split time between parents, or grandparents who help daily from next door. Note those links too.
You might end up with something like "a blended, multigenerational family with an adopted child." That's not unusual at all. Most real families need a few words to describe accurately, and that's exactly why sociologists use a list of structures rather than a single definition.
Talking With Kids About Different Family Structures
Kids notice early that families look different. One friend has two moms, another lives with Grandma, another has a stepdad and a half-brother. Simple, matter-of-fact language helps them make sense of it.
- Start with what families do. A family is the people who love you and take care of you. That definition fits every structure on this page and gives kids a solid base.
- Name the structures plainly. "Some kids live with one parent, some with two, some with grandparents, and some have stepparents too." No structure needs to be explained as a problem.
- Use their own family as the example. Drawing a simple family tree together, with everyone who matters to your child, makes the ideas concrete.
- Answer the question that's asked. Young kids usually want a short, honest answer, not a full lesson. You can add more as they get older.
- Be ready for school projects. Family tree assignments can be tricky for adopted, foster, kinship and blended families. It's fine to adapt the template so it includes everyone your child considers family, and to talk to the teacher if needed.
Many parents find that kids feel more at ease when they see families like their own in books, lessons and everyday conversation, and that the topic gets easier each time it comes up. The same goes for adults building a family tree: a chart that shows your family as it really is will always be more useful than one forced into a shape that doesn't fit.
Common Mix-Ups About Family Structures
- "Extended family and multigenerational mean the same thing." They overlap but aren't identical. An extended family household can include aunts and cousins of the same generation; a multigenerational household is specifically about two or more adult generations, or grandparents with grandchildren.
- "Single-parent means only one parent is involved." It describes the household. The other parent may be closely involved from another home.
- "Blended and step families are different things." They're used for the same thing. "Blended" is a newer, warmer-sounding word; "stepfamily" is the traditional one and the term the Census uses.
- "Half-siblings and stepsiblings are the same." Half-siblings share one parent. Stepsiblings share none; they're connected only through their parents' marriage.
- "Foster and adoptive families are the same." Adoption is permanent and legal. Foster care is usually temporary, with reunification as the first goal.
- "A couple without kids isn't a family." By the Census definition and in most people's eyes, a married couple is a family. OpenStax reports 92% agreement in the Indiana survey.
- "Family and household are interchangeable." In statistics, they're not. A household is everyone under one roof; a family is the related people in it.
Why Family Structure Matters on a Family Chart
Knowing your family's structure helps in practical ways. It tells you which kind of chart to draw, it helps you explain relationships to kids, and it makes records clearer for future family historians. A pedigree chart tracks ancestors and stays the same whatever your household looks like. A descendant chart or family tree shows every union and child. A genogram adds who lives with whom and how close they are. Most families with a blended, adoptive or kinship-care story find it helpful to use more than one.
Family structure also affects the vocabulary you need. A blended family needs step- and half- terms. An adoptive family may use both birth and adoptive terms. A multigenerational family may need clear names for three generations living together. And a family formed by marriage brings in a whole set of in-law terms.
Bringing the Types of Family Structures Together
The types of family structures sociologists describe, from nuclear and single-parent to extended, blended, adoptive, foster, kinship, cohabiting, same-sex and chosen families, are really snapshots of how people live and care for one another at a given time. Most families pass through several over the years, and many fit more than one at once. What stays constant underneath is the web of relationships: parents, children, siblings and the relatives who connect through them.
To map the relatives that marriage adds to any of these structures, head back to our in-law relationship chart. And when you want to name exactly how two people in your family connect, whether through blood, marriage or a stepparent, try our free family relationship calculator: you pick how two people connect, and it names the relationship.
Frequently Asked Questions
What are the main types of family structures?
The most commonly listed types are the nuclear family, the single-parent family, the extended family, and the blended family or stepfamily. Sociology courses usually add adoptive families, foster families, kinship care families where grandparents or other relatives raise children, childless couples, cohabiting couples, same-sex couple families and multigenerational households. Some lists also include chosen family, meaning close friends treated as relatives. Many families fit more than one type at once, and most move between types over a lifetime.
What is the difference between a nuclear family and an extended family?
A nuclear family is two parents and their children living together. An extended family household includes at least one parent and child plus other relatives, such as grandparents, aunts, uncles or cousins. The phrase extended family is also used more loosely for all the relatives outside your immediate household, whether or not you live with them. In sociology, the household definition is the one that matters when describing family structure.
What is a blended family?
A blended family, also called a stepfamily or recombined family, forms when a couple comes together and at least one partner already has children from a previous relationship. Children may gain a stepparent, stepsiblings who share no parent with them, and half-siblings who share one parent. Pew Research Center found that about 16 percent of US children lived in blended families, a share that has stayed fairly steady since the early 1990s.
What is the most common family structure in the US?
For children, living with two parents is still the most common arrangement. Pew Research Center found 69 percent of children lived with two parents in 2014, and the Census Bureau reported that 75 percent of children under 6 lived with two parents in 2023. Among all households, though, married couples are now fewer than half. The Census Bureau estimated that 47 percent of households were married couples in 2025, and 29 percent were people living alone.
Is a single person living alone considered a family?
Not in Census Bureau statistics. The Census defines a family as two or more people related by birth, marriage or adoption who live together, so a person living alone is counted as a one-person, nonfamily household. In everyday life, of course, that person is still part of a family as someone's child, sibling, parent or cousin. One-person households are growing: there were 39.7 million in 2025, about 29 percent of all US households.
What is the difference between foster care, adoption and kinship care?
Adoption is a permanent legal process that makes the adoptive parents a child's legal parents. Foster care is usually temporary: a child welfare agency places a child with licensed caregivers, and the first goal is often reuniting the child with their family. Kinship care means grandparents, other relatives or close family friends raise a child whose parents can't. Kinship care can be informal, arranged through child welfare, or made permanent through guardianship or adoption.
What is a multigenerational household?
Pew Research Center defines a multigenerational household as a home with two or more adult generations, mostly adults 25 and older, or grandparents living with grandchildren under 25. By that definition, about 59.7 million Americans, or 18 percent of the population, lived in multigenerational homes in 2021, up from 7 percent in 1971. Common reasons include sharing costs, caring for children or older parents, cultural tradition and young adults saving money.
What does family of orientation mean?
Family of orientation is the sociology term for the family you're born into or raised in: your parents and siblings. Family of procreation is the family you form as an adult, through marriage or partnership and often children. Most people belong to both over a lifetime. On a family tree, your family of orientation sits on the row above you, while your family of procreation sits on your own row and the rows below.
How do you show different family structures on a family tree?
Draw each union separately, and connect each child to the specific parents they came from or were adopted by. Use labels or line styles for special cases: a double slash for divorce, a dashed line for an unmarried couple, and a dotted or labeled line for adoption. Foster placements and chosen family are usually notes rather than parent lines. For households and closeness, a genogram works better than a standard tree, since it can circle everyone living under one roof.
Sources
We checked every source below while writing this guide. Last reviewed October 30, 2026, by Joan Ramos.
- Introduction to Sociology 3e, 14.1 What Is Marriage? What Is a Family? (OpenStax, Rice University)
- Introduction to Sociology 3e, 14.2 Variations in Family Life (OpenStax, Rice University)
- Current Population Survey: Subject Definitions (U.S. Census Bureau)
- Census Bureau Releases New Estimates on America's Families and Living Arrangements (2025) (U.S. Census Bureau)
- Three-Quarters of Children Younger Than 6 Years Old Live With Two Parents (2023) (U.S. Census Bureau)
- Parenting in America: 1. The American Family Today (Pew Research Center)
- The Demographics of Multigenerational Households (Pew Research Center)