7 Generation Family Tree Chart: 127 Ancestors, and How to Actually Chart Them
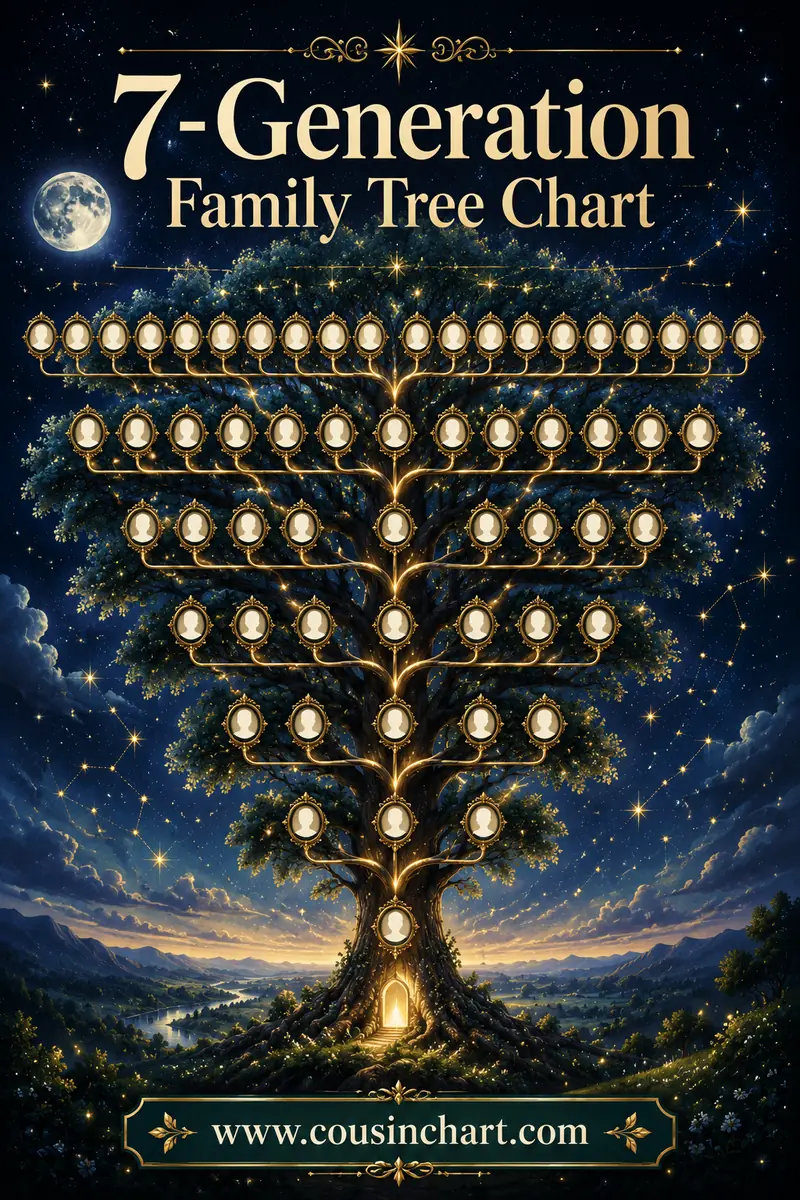
A 7 generation family tree chart holds 127 people: you, 2 parents, 4 grandparents, 8 great-grandparents, 16 great-great-grandparents, 32 third-great-grandparents and 64 fourth-great-grandparents. You count as generation 1. That's a lot of boxes for one sheet of paper, which is why seven-generation charts are almost always printed oversized, drawn as a fan, or split across continuation sheets.
If you're ready to start one, our printable family tree charts include the layouts that handle this size sensibly. Read the sizing section below before you hit print — a 7-generation chart squeezed onto Letter paper is genuinely unusable.
Free printables for this page
Download a blank PDF (US Letter or A4) — free, no sign-up — or customize it in the maker above before printing.
 7-Generation Fan Chart (Poster)127 wedges, sized for 11×17 tabloid; also prints on Letter.
 6-Generation Pedigree Chart63 ancestors on one portrait page; names-only outer column.
 Pedigree Continuation Sheet
 Ahnentafel Ancestor List
How big does each generation get? Tap a level to see the count — and what it means for your paper.
Tap a generation above to see the numbers.
Print a large blank ancestor chart →What is a 7 generation family tree chart?
It's an ancestor chart — a pedigree chart — extended to seven levels. You sit at one end, and every box beyond you is a direct ancestor: parents, grandparents, and so on back four more times.
Like every pedigree chart, it shows only your direct line. No siblings, no cousins, no aunts or uncles, not even your own children. That restriction is what makes seven generations possible at all. If you tried to include everyone's brothers and sisters you'd be into the thousands of people and no sheet of paper would save you.
Seven is where charting stops being a printing job and starts being a design problem. Six generations is awkward. Seven forces a real decision about format.
Why 127 and not 128
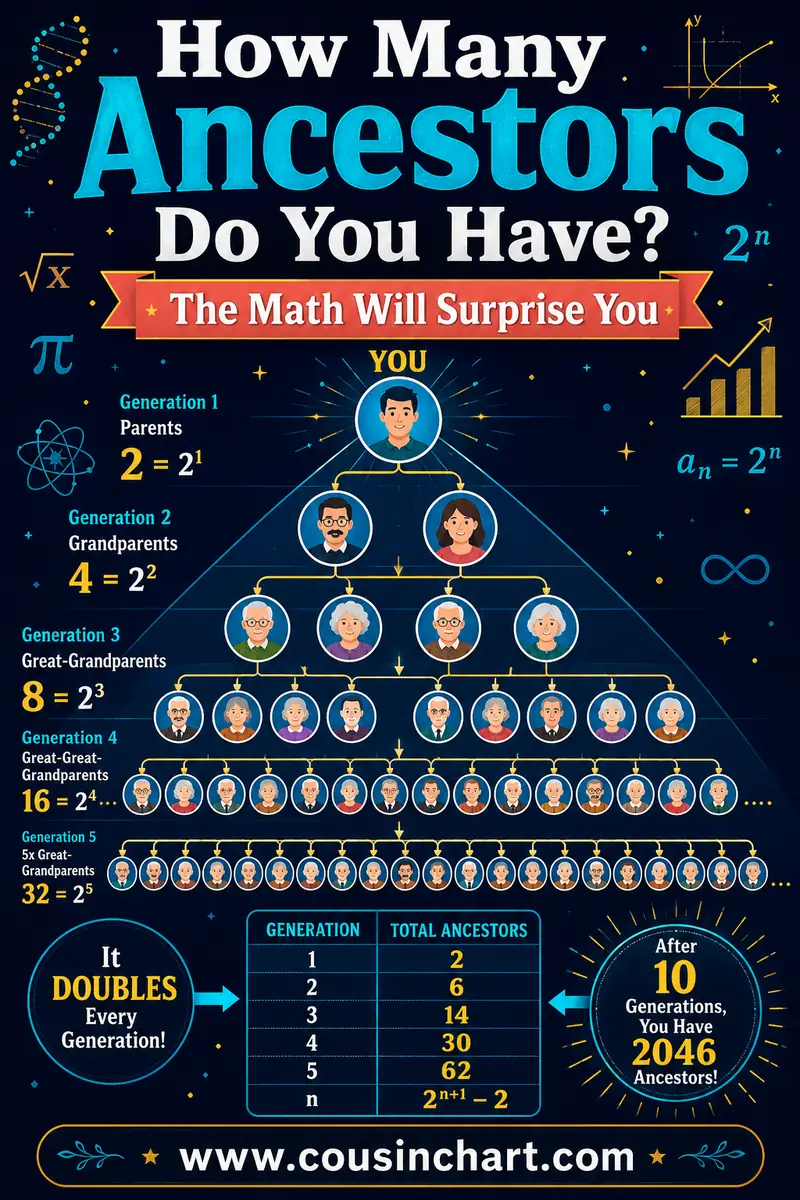
The count includes you. Generation 1 is one person, and every level doubles from there: 1, 2, 4, 8, 16, 32, 64. Those add to 127.
The sum of a doubling sequence is always one less than the next number in it, which is why totals go 1, 3, 7, 15, 31, 63, 127, 255 and never land on anything round. Same reason a 12 generation family tree chart holds 4,095 people rather than 4,096.
How many ancestors does each generation add?
| Generation | Relationship to you | Ancestors in that generation | Running total |
|---|---|---|---|
| 1 | You | 1 | 1 |
| 2 | Parents | 2 | 3 |
| 3 | Grandparents | 4 | 7 |
| 4 | Great-grandparents | 8 | 15 |
| 5 | 2nd-great-grandparents | 16 | 31 |
| 6 | 3rd-great-grandparents | 32 | 63 |
| 7 | 4th-great-grandparents | 64 | 127 |
Notice what that final row does. Generation 7 alone contains 64 people — more than the other six generations combined. Half your chart is one column. That single fact drives every practical decision about printing, layout and how you spend your research time.
It also explains why the numbers get silly fast. Ten generations would be 1,023 people; twenty would be over a million. Our piece on how many ancestors you have follows the doubling to the point where it collides with actual human population — and explains why it doesn't literally mean you had a million distinct ancestors.
How far back does 7 generations actually reach?
Genealogists usually reckon on 25 to 30 years per generation, longer in families where men married late and had children into their fifties, shorter where people married young.
At that rate, seven generations reaches roughly 150 to 180 years before your own birth. For someone born in 1980, generation 7 sits broadly in the early-to-mid 1800s. For someone born in 1950, you're looking at the late 1700s to early 1800s.
Don't treat that as precise. Generation lengths vary wildly between branches of the same family — one line can run a full century ahead of another by generation 7, purely because of who married young. It's a planning estimate, not a fact about your family.
What that means for records
The era matters more than the number. In the United States, generation 7 usually predates civil birth and death registration, which most states only began in the late 1800s or early 1900s. You'll be working with:
- Census records — US federal censuses from 1790 onward, though pre-1850 censuses name only the head of household and count everyone else in age brackets
- Church registers — baptisms, marriages and burials, often the only vital records that exist for this period
- Probate and land records — wills that name heirs are frequently the clearest surviving statement of who was related to whom
- Tax lists, military records, and court minutes — thin, but sometimes the only trace of a person
Free access matters at this depth, because you'll be searching a lot. Our FamilySearch guide covers the biggest free collection of exactly these record types, and tracing a family tree for free is worth reading before you subscribe to anything.
How do you print a 7 generation chart?
You have three genuinely workable options and one that always disappoints.
Option 1: The fan chart
A genealogy fan chart arranges generations as concentric arcs radiating from you at the center. Because the circumference of each ring grows as you move outward, the geometry naturally gives the biggest generation the most room — which is exactly backwards from a rectangular chart, where every column gets the same width whether it holds 2 boxes or 64.
That's why fan charts dominate at six, seven and eight generations. A 7-generation fan on 11×17 paper is readable. A 7-generation rectangular chart on the same sheet is not.
The trade-off: outer-ring text runs at an angle or curves, so it's harder to fill in neatly by hand and harder to skim than a straight column. Fans are display-first. If it's going on a wall, this is your format.
Option 2: One oversized sheet
If you want the classic boxes-and-lines look at seven generations, you need real paper. 11×17 inches (tabloid) or A3 is the practical minimum, and even then the last column will be cramped. 18×24, 24×36 or a plotter-printed roll makes it genuinely comfortable.
Any print shop will run an oversized PDF for a few dollars. Two things to check before you send the file: that your PDF's page size actually matches the paper you're ordering, and that the shop isn't going to auto-scale it to fit. Landscape orientation always beats portrait for a chart, because charts grow sideways.
Option 3: Continuation sheets
This is what serious researchers actually use day to day, and it's the option most people have never heard of.
Instead of one giant chart, you print several standard-size charts and link them. Chart 1 holds generations 1–5 with you in box 1. Then every person sitting in the far-right column of chart 1 becomes person 1 on their own new chart, which carries their next five generations.
Each sheet gets a number, and each end-of-chart box carries a note: "continued on chart 7." Each continuation sheet carries a matching note at its start: "chart 7 — person 1 is person 22 on chart 1."
The advantages are real: everything prints on ordinary paper, sheets live in a ring binder, you can add depth to one line without reprinting anything else, and you can hand a single branch to a cousin without giving them your entire tree. The disadvantage is that you never see the whole thing at once. Most people end up doing both — continuation sheets for working, one big fan for the wall.
The option that disappoints
Shrinking a 7-generation rectangular chart onto US Letter. You can do it. The text lands at about 4 to 5 points, you can't write in the boxes by hand, and nobody over forty can read the outer columns without a magnifier. If it must live on Letter paper, use continuation sheets instead.
Format comparison
| Format | Paper | Readable at 7 gen? | Hand-fillable? | Best for |
|---|---|---|---|---|
| Fan chart | 11×17 / A3+ | Yes | Awkward on outer rings | Display, gifts, wall art |
| Single wide chart | 18×24 or larger | Yes | Yes | Reunions, framed pieces |
| Continuation sheets | Letter / A4 | Yes, per sheet | Yes | Active research, binders |
| Compressed to Letter | Letter / A4 | No | No | Nothing, honestly |
How does Ahnentafel numbering keep 127 people straight?
At seven generations, numbering stops being optional. Without it you will lose track of which "John Miller" belongs where, and continuation sheets become impossible to cross-reference.
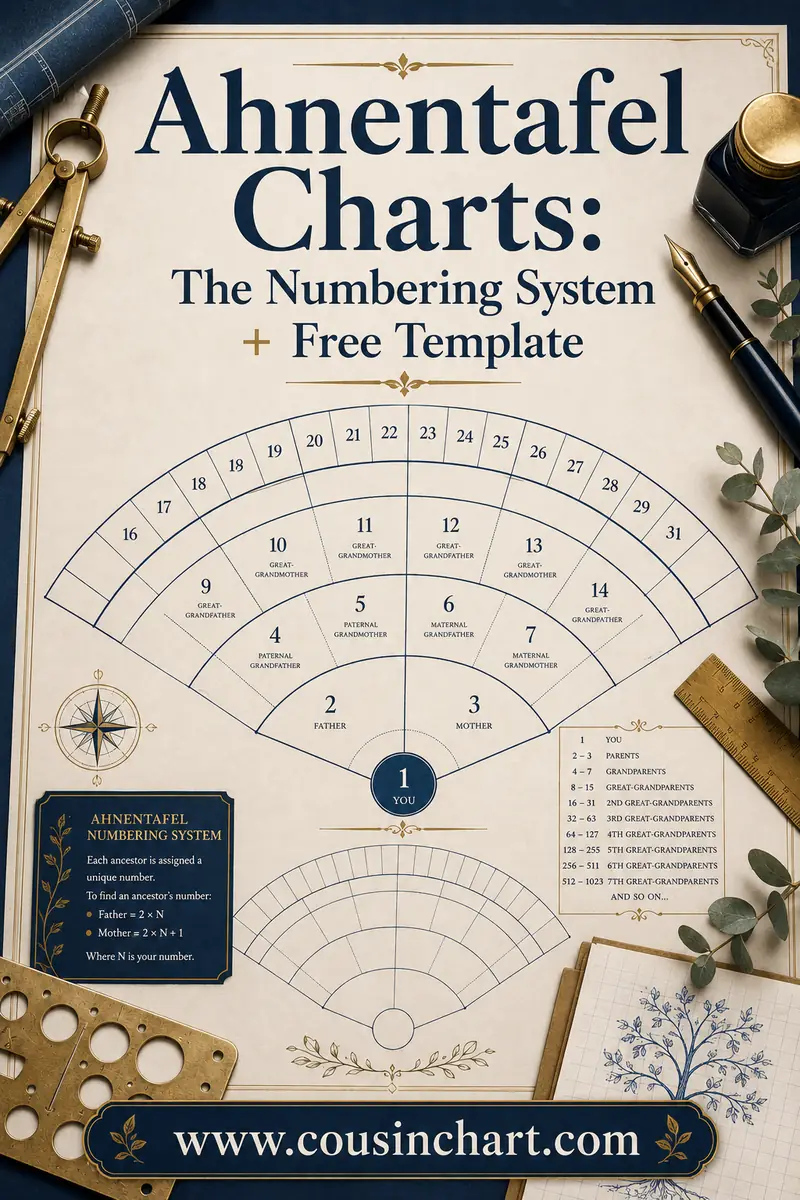
Ahnentafel numbering (German for "ancestor table") solves it with one rule:
- You are 1
- Your father is 2, your mother is 3
- For any person, their father = their number × 2, their mother = their number × 2 + 1
That's the entire system, and it has some lovely properties:
- Every man has an even number. Every woman has an odd number. An odd number on a male ancestor means you've made an error — instant proofreading.
- Halving works backwards. Take any number, halve it (rounding down), and you get that person's child on your direct line. Person 47's child is 23; person 23's child is 11.
- Each generation occupies a clean block. Generation 1 is number 1. Generation 2 is 2–3. Generation 3 is 4–7, then 8–15, 16–31, 32–63, and generation 7 is 64–127.
That last point is what makes continuation sheets work. If chart 4 starts with person 22, you know instantly that he's male (even number), that his child on your direct line is person 11, and that his own parents are numbers 44 and 45. Numbers carry their relationships with them, so a sheet never needs explaining.
Ahnentafel numbers are also excellent for filing. Name your scanned documents with the ancestor's number first — `044_Miller_John_1838_census.jpg` — and your folder sorts itself into generational order with no effort. Our Ahnentafel chart guide goes through the full system, including how to write out a numbered ancestor list.
What do you write in each box?
At seven generations, space is the constraint, so decide your format before you start writing and never deviate.
Standard contents for each box:
- Full name — surname in capitals is a common convention (JOHN MILLER), and maiden names always for women
- b. birth date and place
- m. marriage date and place
- d. death date and place
Everything else — occupations, immigration, military service, source citations, stories — belongs in your files, not on the chart. Be honest about what a printable chart is: a display and planning tool. The research itself lives in your notes, your logs and your document scans. The chart is the map, not the territory.
Date and place conventions that save you later
Write dates as DD MMM YYYY — 14 Sep 1823 — with the month spelled out. Numeric dates are ambiguous across countries, and seven generations back you're frequently working with records from other countries.
Use the standard qualifiers for uncertainty: abt (about), bef (before), aft (after), c. or circa. On a 7-generation chart, half your entries will be approximate, and that's fine as long as the chart says so.
For places, record the name as it stood at the time of the event. Counties split, borders moved, and villages were absorbed. A birth recorded in 1830 in "Kingdom of Prussia" is filed under Prussia in the archives, whatever the region is called now. Where the modern name differs and matters to you, add it in brackets.
Abbreviate places consistently. If you use "Co." for county on one box, use it on all 127.
What can you realistically fill in?
Here's the part most articles skip. Almost nobody completes a 7-generation chart.
Filling all 64 boxes in generation 7 means identifying 64 people born roughly 150–180 years before you, across every single one of your ancestral lines, with none of them dropping out. Even experienced researchers with decades of work and good record survival usually have a chart that's dense on some branches and empty on others.
Realistic expectations by generation:
| Generation | Ancestors | What a diligent researcher typically achieves |
|---|---|---|
| 1–4 | 15 | Complete, or very close |
| 5 | 16 | Mostly complete for most families |
| 6 | 32 | Perhaps half to two-thirds, unevenly spread |
| 7 | 64 | A minority — often a strong quarter to a third |
Those are ranges from ordinary experience, not a measured statistic, and your mileage depends almost entirely on what records survived where your family lived.
Why lines stop
Some walls are structural, and no amount of skill gets past them:
- Records were never created. Civil registration is recent in many places. If no church kept a register in that parish, the event simply isn't written down anywhere.
- Records were destroyed. Courthouse fires, floods and wars removed whole counties' worth of history. The 1890 US federal census was almost entirely lost following a 1921 fire, taking a crucial decade with it.
- Enslaved ancestors were rarely recorded by name before emancipation, and often appear in property records rather than as people. African American research at this depth requires a different and much harder toolkit.
- Migration breaks the chain. An immigrant ancestor whose birthplace was recorded only as a country stops the line until you find the record that names the town.
- Illegitimacy, adoption and informal fostering put a father's name beyond reach in many registers.
None of that is a failure on your part. It's the shape of the surviving evidence. An honest 7-generation chart with 30 filled boxes and 34 question marks is a truthful document, and it's worth infinitely more than one padded out with names copied from strangers' online trees.
The copying trap
Deep charts are exactly where copied errors live. A wrong link at generation 5 hands you 4 fabricated people at gen 6 and 8 more at gen 7 — and those errors get copied onward by other people until the mistake looks like consensus because twelve trees agree.
Before you write anything in columns 6 and 7, ask what record supports it. If the answer is "another family tree online," it's a lead to check, not a fact to chart.
Mistakes people make on 7 generation charts
- Miscounting generations. Seven generations means you plus six levels of ancestors. If your chart has 127 boxes, it's a 7-generation chart, whatever it's labeled.
- Printing too small. The single most common regret. Print bigger than you think you need.
- Skipping the numbering. At 127 people, unnumbered continuation sheets become impossible to reconcile.
- Filling one branch to seven and the rest to four. Depth on one line looks impressive and teaches you less than balanced breadth.
- Married surnames for women. At this depth, a missing maiden name doesn't just stall one box — it kills 32 potential ancestors behind her.
- Inconsistent abbreviations. Decide once whether it's "Co.", "County" or nothing, then hold the line for all 127 boxes.
- Treating the chart as the archive. It's a summary. Keep sources in a research log, not squeezed into a box in 4-point type.
- Framing it too early. Charts get corrected constantly. Work in pencil, frame the version you've actually proved.
Should you go past 7 generations?
Only if seven is genuinely full, and only in a format built for it.
An 8-generation chart holds 255 people, a 10-generation chart holds 1,023, and a 12 generation chart holds 4,095. Past about eight, rectangular layouts stop working entirely and you're into fan charts, poster prints, or software-generated multi-page reports.
There's also a research reality: for most families the practical documentary limit sits somewhere in the 1700s to early 1800s, which is roughly where generation 7 or 8 lands. Charts advertising twelve generations are usually mostly-empty display pieces, or they contain a lot of borrowed genealogy that nobody has checked. If you want to see how the different layouts compare before committing, our guide to family tree chart types lays them out side by side.
FAQ
How many people are on a 7 generation family tree chart?
- That's you (1), parents (2), grandparents (4), great-grandparents (8), 2nd-great-grandparents (16), 3rd-great-grandparents (32) and 4th-great-grandparents (64). You count as generation 1, which is why the total is 127 rather than 128.
What size paper do I need for a 7 generation chart?
11×17 inches (tabloid) or A3 is the practical minimum for a fan chart, and larger — 18×24 or bigger — for a rectangular boxes-and-lines chart. If you only have Letter or A4, use continuation sheets: print several small charts and link them with chart numbers instead of squeezing 127 boxes onto one page.
How far back in time does 7 generations go?
Roughly 150 to 180 years before your own birth, using the usual estimate of 25 to 30 years per generation. For someone born in 1980, generation 7 typically sits in the early-to-mid 1800s. Individual branches vary a lot, so treat it as a planning estimate rather than a fixed date.
What is Ahnentafel numbering and do I need it?
It's the standard ancestor numbering system: you are 1, your father is 2, your mother is 3, and from there anyone's father is their number doubled while their mother is their number doubled plus one. At seven generations it's close to essential, because it lets you cross-reference continuation sheets and file documents without confusion.
Is it realistic to fill in all 127 boxes?
For most people, no. Completing generations 1 through 5 is achievable; generations 6 and 7 usually stay partly blank because records were never created, were destroyed, or don't name the people you need. A partly-filled chart with honest question marks is a better document than a full one built on copied guesses.
Should I use a fan chart or a rectangular chart for 7 generations?
Fan charts handle seven generations far better, because each outer ring has more physical space for the generation that has the most people. Rectangular charts give every generation the same width, so the 64-person column becomes unreadable unless the paper is very large. Use a fan for display, rectangular continuation sheets for working research.
Start big, but start honest
Seven generations is an ambitious chart, and it's worth doing — as long as you print it large enough to use, number it properly, and let the empty boxes stay empty until you've earned the right to fill them.
Pick a layout from our printable family tree collection, or start with a standard pedigree chart template and use the continuation-sheet method to grow it one branch at a time. And when a distant match turns up and you can't work out how they connect, our family relationship calculator will name the relationship for you — and the DNA match calculator will tell you whether the shared centimorgans back it up.