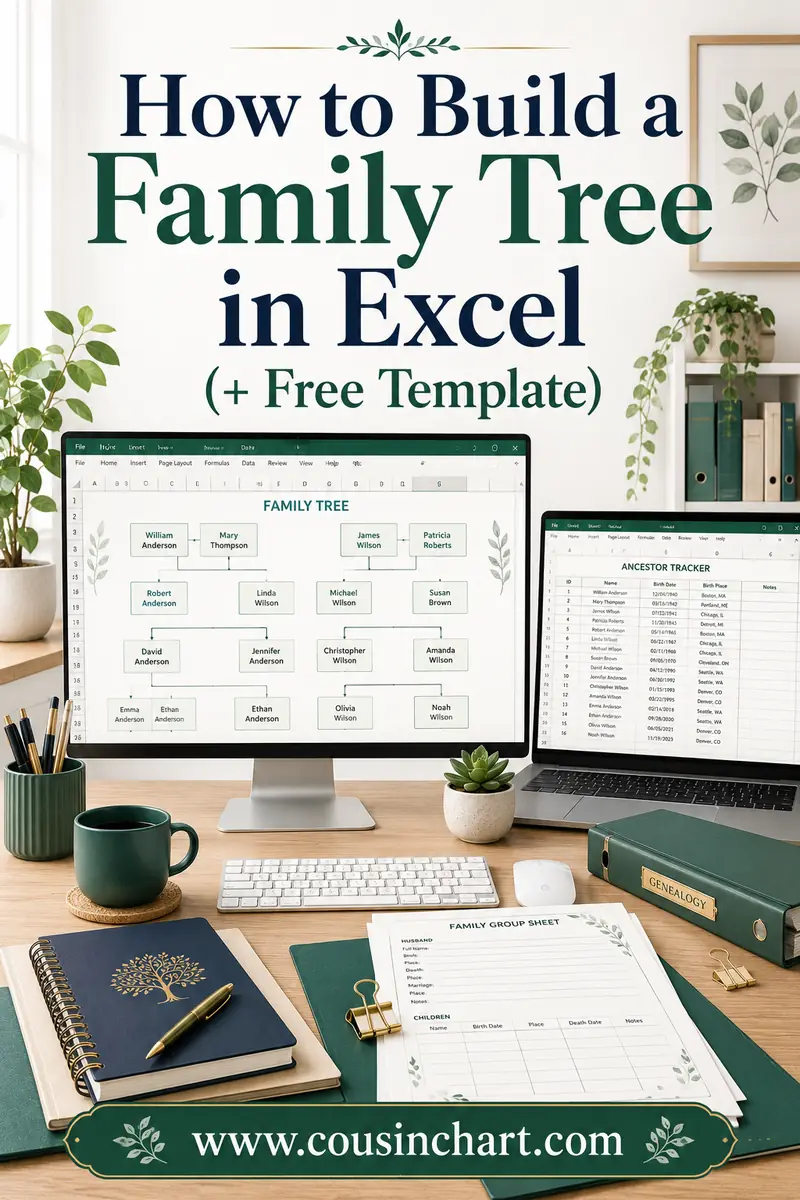
How to Build a Family Tree in Excel (+ Free Template)
Excel is a genuinely good family tree tool for one reason: a spreadsheet is already a grid of boxes, and a family tree is just boxes with rules about which ones touch. The working method is merged cells — one column per generation, each ancestor's cell spanning twice the rows of the generation before — plus borders for the connecting lines. No drawing, no drifting text boxes, and a canvas that scrolls as far as your research does.
This guide builds the ancestor grid step by step, adds the one formula that turns Excel into a self-numbering ahnentafel, covers the SmartArt shortcut and the descendant-style variant, and ends with the print settings that keep your tree from being silently shrunk to confetti. If you'd rather skip straight to filling something in, the free CousinChart printable pack has finished chart PDFs — and either way, the free relationship calculator handles the "okay but what is she to me?" moments that every filled grid produces.
Free printables for this page
Download a blank PDF (US Letter or A4) — free, no sign-up — or customize it in the maker above before printing.
 3-Generation Family TreeYou, parents and grandparents. Portrait, big boxes, 10 minutes to fill.
 4-Generation Pedigree Chart
 5-Generation Pedigree Chart
 Blank Fan Chart (5 Generations)
Relationship quick-check: tap a phrase to see who they are — worth knowing before you merge their cells.
Tap a phrase above to see the answer.
Work out any family relationship →The merged-cell grid, step by step
We'll build a 4-generation ancestor chart — you plus 14 ancestors, the classic 15-slot pedigree — reading left to right.
1. Block out the columns. Column A is you, B is parents, C is grandparents, D is great-grandparents. Widen them all to about 25 characters (drag the column header edges, or select all four and set one width).
2. Do the merge math. Give the outermost generation one row each, then double going inward. With 8 great-grandparents in D occupying one row each (rows 1–8), each grandparent in C merges 2 rows (C1:C2, C3:C4, C5:C6, C7:C8), each parent in B merges 4 (B1:B4, B5:B8), and you merge all 8 in A (A1:A8). Select the range, then Home → Merge & Center. Every ancestor now sits vertically centered between their own two parents — the geometry of a pedigree chart, produced by arithmetic.
3. Rule in the "lines." Borders play the connector role: give each merged cell an outline border, and the tree structure appears on its own. For the classic bracket look instead of full boxes, border only each cell's right edge plus the top/bottom edges joining parent pairs.
4. Style once, then stop. Light fill for men's cells, a different light fill for women's (or color by family line — one hue per grandparent's branch is genuinely useful at a glance), wrap text on, vertical alignment centered. Name on the first line; birth–death years on the second: Alt+Enter makes the line break inside a cell.
5. Need five generations? Add column E, give its 16 ancestors one row each (rows 1–16), and double every merge behind it: D cells now span 2 rows, C span 4, B span 8, A spans 16. The pattern extends indefinitely — six generations means 32 base rows, and Excel will not blink. Your printer will; see below.
The formula that numbers your ancestors
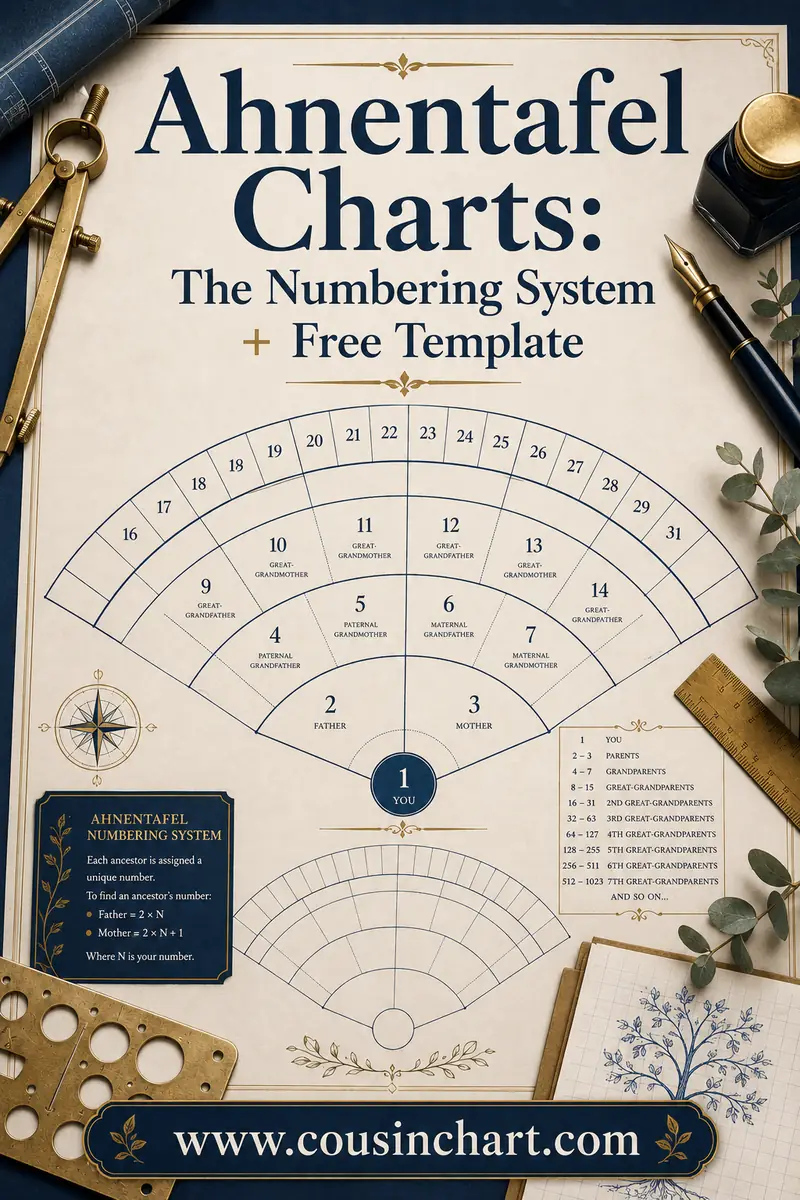
Here's the trick that makes Excel more than a drawing surface. Ahnentafel numbering — you are 1, anyone's father is double their number, mother is double-plus-one — is pure arithmetic, and Excel does arithmetic. Keep a second sheet as a numbered ancestor list: column A the ahnentafel number, column B the name. Then:
- Father's number of the person in row n: `=A2*2`
- Mother's number: `=A2*2+1`
- Generation: `=INT(LOG(A2,2))+1` — the power-of-2 bracket the number falls in
- Sex from the number alone: `=IF(A2=1,"—",IF(ISEVEN(A2),"M","F"))`
Type numbers 1 through 63 down the sheet (a two-second fill series) and you've got a self-labeling six-generation ahnentafel: every row announces its generation and sex before you've entered a single name. Researchers keep this list sheet as the master data and treat the merged-cell chart as the display view — the same list/chart pairing paper genealogy uses, in one workbook.
The SmartArt shortcut (and its ceiling)
Excel has the same SmartArt hierarchy diagrams as Word: Insert → SmartArt → Hierarchy, type names in the text pane, restyle in a click. It's the fastest route to a small descendant tree — a couple, their kids, their grandkids — and it's fine for that. Its ceiling is the same one it has everywhere: org-chart logic gives every box one parent, so two-parent families need the shared-couple-box workaround, and remarriages get ugly fast. The full SmartArt walkthrough (plus the text-box method for complicated families) is in the Word template guide — everything there applies inside Excel unchanged.
Descendant-style trees in Excel
Flip the grid on its side for a top-down family tree: one row per generation, founders in a merged cell across the top, children in the row below, each child's cell merged across the columns their own children occupy. It works, with one warning from experience: descendant trees are ragged — families have uneven numbers of kids — so plan the bottom generation first (one column per grandchild, say 20 columns), then merge upward. Building top-down forces constant re-merging as branch sizes reveal themselves; building bottom-up is arithmetic again.
Excel's genuine advantage here is capacity: a reunion tree with 150 descendants is miserable in Word and routine in a spreadsheet — and the tabs at the bottom solve the multi-family problem: one worksheet per grandparent line, one workbook for the whole family.
Beyond the chart: Excel as the family database
Here's the move that makes Excel the last tree tool many families ever need: stop thinking of the workbook as one chart and start treating it as a tiny database with chart views on top.
Add a sheet called People — one row per person, one column per fact: ID number, full name, maiden name, sex, birth date, birth place, death date, father's ID, mother's ID, spouse's ID, and a notes column. Enter everyone once, and suddenly the questions no drawn chart can answer become one-click operations:
- Sort by birth date and you've got the family timeline — who was alive when, which cousins overlapped which grandparents.
- Filter by birth place and the migration story appears: forty rows of "Iloilo" giving way to "Cebu" in the 1950s.
- A birthday view takes one helper column — `=TEXT(E2,"mm-dd")`, sorted — and produces the printable list that ends the family's annual "wait, whose birthday is this week?" problem.
- Count anything. `=COUNTIF(D:D,"F")` for the running daughters-to-sons tally; COUNTIFS by decade for a births-per-generation chart the reunion will actually enjoy.
- Age math is a formula. `=DATEDIF(E2,G2,"Y")` turns birth and death columns into lifespans, and the family's longevity pattern — or the heartbreaking infant rows — becomes visible data.
The father/mother ID columns are the quiet stars: they encode the entire tree structure without a single merged cell, which means the drawn chart is now just a view you can rebuild anytime, while the People sheet remains the single source of truth. This is, not coincidentally, exactly how real genealogy software stores families internally — you're building a friendly, transparent version whose file format will still open in thirty years.
Practical habits that keep the database healthy: dates in ISO format (1931-05-04) in the cells so sorting never lies, with display formatting layered on top; one "sources" column citing where each row's facts came from; and a duplicate check (`=COUNTIF(B:B,B2)>1` flagged with conditional formatting) before big reunions, when three relatives inevitably submit the same cousin with three spellings.
Printing: where Excel trees go to die
Every Excel tree horror story is a printing story, so, the settings that matter:
- Set a print area. Select exactly the chart range → Page Layout → Print Area → Set Print Area. Otherwise stray cells three screens away drag blank pages into the job.
- Landscape, Page Layout → Orientation.
- Beware "Fit Sheet on One Page." It scales down without limit — a six-generation chart obligingly fits on Letter at 40% and prints unreadable. Check the scaling percentage (Page Layout → Scale to Fit); below about 75%, print on bigger paper instead of smaller type.
- Print preview shows the truth — page breaks, scaling, orphaned columns. Ctrl+P and look before committing paper.
- Export to PDF for copy shops and relatives (File → Export). A PDF at 11×17" turns your five-generation grid into a wall chart for pocket change; the emailed .xlsx would have reflowed on their machine, the PDF can't.
- Freeze panes for on-screen work (View → Freeze Panes) so the generation headers hold still while you scroll a big tree — this is for editing comfort, not printing, but it's the difference between navigating and being lost.
Excel vs. the alternatives, honestly
Inside Excel itself, the three approaches split the work like this:
| Approach | Pros | Cons |
|---|---|---|
| Merged-cell grid | Auto-centered pedigree geometry; no drifting boxes; extends to any generation count | Ancestor-direction by nature; adding generations means re-merging the whole cascade |
| SmartArt hierarchy | Fastest route to a small descendant tree; one-click restyling | Org-chart logic gives every box one parent; remarriages get ugly fast |
| List / database sheet (one row per person) | Unlimited size; sortable, filterable, formula-friendly; the durable single source of truth | Not visual — it needs a chart view built on top to show anyone |
Excel wins on canvas size, editability, and the numbering formulas; it loses on charm — a merged-cell grid will never look hand-lettered — and on collaboration, where Google Docs and Sheets let the cousins fill their own branches live. And for the "I just want to print something and write on it at grandma's" case, skip software entirely: the free CousinChart printable pack's charts are that finished PDF. The strongest workflow uses both — Excel as the master record (the numbered list sheet especially), printables as the display and gathering layer.
FAQ
How do I make a family tree in Excel?
Use merged cells: one column per generation, the oldest generation one row per person, each closer generation merging double the rows (8-4-2-1 for four generations). Borders form the connecting lines, and each ancestor sits automatically centered between their parents. SmartArt hierarchy diagrams work for small descendant trees.
Is Excel or Word better for a family tree?
Excel for size, structure, and easy editing — the grid does the layout for you and scales to hundreds of people across worksheet tabs. Word for a small polished one-pager with SmartArt styling. For collaborative filling, Google's tools beat both; for instant printing, a ready-made PDF chart beats all three.
How many generations can an Excel family tree hold?
Structurally unlimited — six generations is 32 base rows, ten is 512, and Excel handles either. The practical limit is printing: four to five generations fit legibly on home paper sizes, and bigger trees should export to PDF for large-format printing.
Can Excel calculate ancestor numbers automatically?
Yes — ahnentafel numbering is arithmetic. If a person's number is n, their father is n×2 and mother n×2+1; `=INT(LOG(n,2))+1` gives the generation, and ISEVEN(n) gives sex. A fill series of 1–63 plus those formulas produces a self-labeling six-generation ancestor list.
Why does my Excel family tree print tiny?
"Fit Sheet on One Page" scales down without limit, so big charts shrink to fit whatever paper is selected. Set an explicit print area, check the scaling percentage under Scale to Fit, and move to 11×17" or PDF export when scaling would drop below about 75%.
Open a workbook and merge the first cells
Fifteen minutes gets you the four-generation grid: widen four columns, merge 8-4-2-1, border the cells, and type the seven names you know. Add the numbered list sheet and Excel starts doing genealogy math for you. Print the fair copy from the free CousinChart pack when it's time for paper — and settle every "wait, second cousin or once removed?" the grid stirs up with the free relationship calculator.