The Leeds Method: Sort Your DNA Matches Into 4 Grandparent Groups
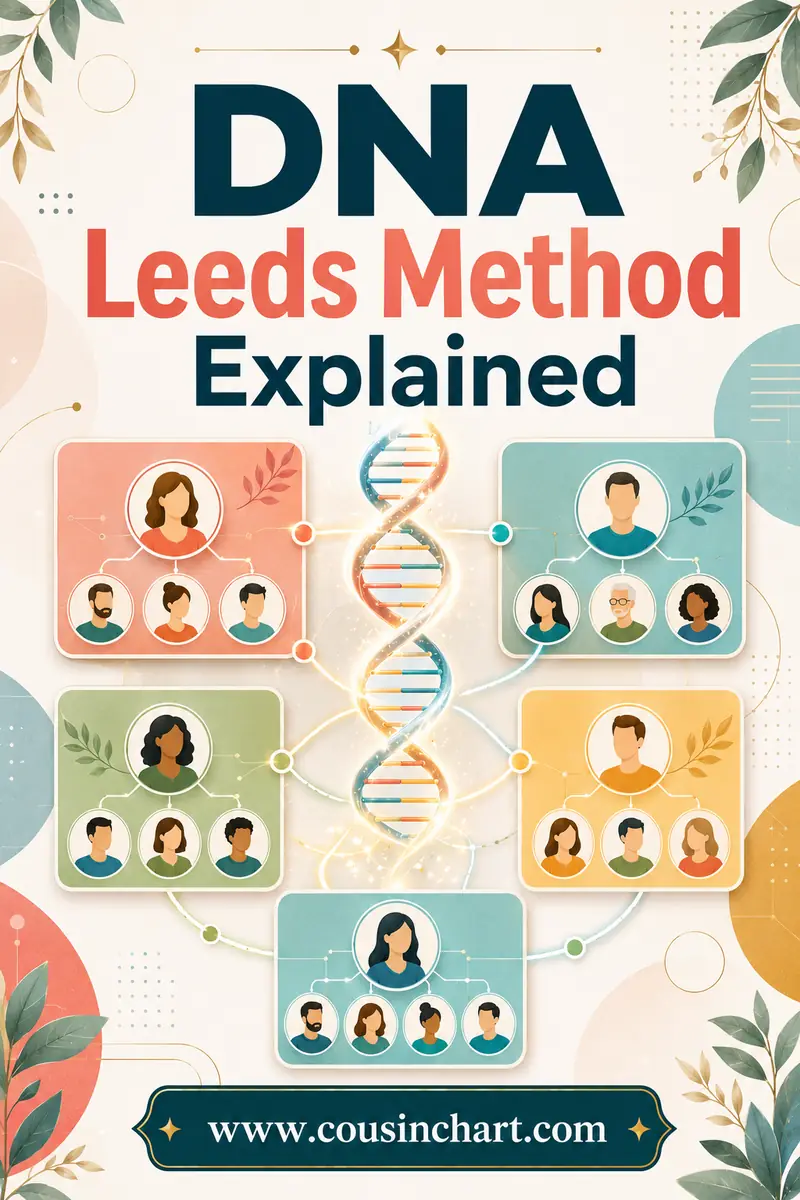
The Leeds Method is a color-grouping technique for DNA matches, created by genealogist Dana Leeds. You take your matches in roughly the second-cousin range — commonly around 90 to 400 centimorgans — list them in a spreadsheet, and color-group anyone who appears on each other's shared match lists. When you're done you'll usually have four clusters, one for each of your four grandparents' lines.
The best part is what it doesn't need. No chromosome browser, no segment data, no paid subscription, no math. It works on AncestryDNA, which is exactly why adoptees and anyone searching for an unknown parent lean on it so heavily. All it needs is a match list and a shared-match feature, and every major testing site has both. If you want to know what the cM numbers in that list actually mean before you start sorting, the free DNA match calculator will translate any of them into likely relationships.
The Leeds Method, one step at a time. Tap a step to see exactly what to do:
Tap a step above to see what to do.
What Is the Leeds Method?
Dana Leeds published the method in 2018 after looking for a way to sort DNA matches without any of the technical machinery the hobby had built up. Her insight was that you don't need to know how two matches are related to each other — you only need to know that they're related, which every testing site tells you for free through its shared-match list.
The whole technique fits in one sentence: matches who show up on each other's shared-match lists are probably connected to you through the same ancestral line, so group them and see how many groups you end up with.
Everything else is bookkeeping. A spreadsheet, some fill colors, and an hour of clicking. There's no algorithm to trust and no probability to misread — you're just recording relationships the site has already worked out.
Why the method caught on
Because it solved the biggest problem at Ancestry, which is where most people test. Ancestry has the largest database in the world and no chromosome browser, which meant that for years the advanced techniques written up in genealogy blogs simply couldn't be used by the majority of testers. The Leeds Method needs nothing Ancestry withholds.
It also produces a result that means something immediately. You don't get a probability or a segment map; you get "these eleven strangers are all on my mother's father's side," which is a genuinely actionable fact.
Why Does the Leeds Method Produce Four Clusters?
This is the elegant bit, and it's worth understanding rather than just accepting.
You have four grandparents. Every one of your ancestors sits behind one of them. So every blood relative you have — apart from your own descendants and your closest relatives — descends from an ancestor on exactly one of those four lines.
Now think about who's in the 90–400 cM window. Those totals typically mean second cousins, second cousins once removed, half first cousins, first cousins once or twice removed, and similar. A second cousin shares one set of great-grandparents with you. Those great-grandparents sit behind exactly one grandparent.
So a second cousin on your father's mother's side matches you and matches every other second cousin on that same line — because they all descend from the same great-grandparental couple. But they have no reason at all to match your mother's side. Different families, no shared DNA.
Run that logic across all your matches and they naturally fall into four non-overlapping piles. One per grandparent.
What each cluster actually represents
Each column corresponds to one grandparent's ancestry — everyone descending from that grandparent's parents and further back. A more precise way to say it: each cluster represents one of your four great-grandparent couples, and therefore the whole branch behind them. Our common ancestor chart lays out how those generations stack up if you want to see the shape of it drawn out.
Why the 90–400 cM window matters so much
The upper limit does the important work. Anyone sharing more than about 400 cM is likely a first cousin, half sibling, aunt, uncle, or closer — and those relatives descend from a grandparent couple, not a single grandparent's line. A first cousin matches you through both your paternal grandfather and your paternal grandmother, so they'd appear in two columns and glue those two clusters into one blurry mess. Leave them out.
The lower limit is about signal quality. Below roughly 90 cM you're into fourth-cousin territory, where the match count explodes, the relationships get vague, and shared-match lists get noisy. There's also a hard practical reason on Ancestry: its shared-match list only displays matches of 20 cM or more, so very distant matches show almost no shared matches to cluster on.
If your list in that window is thin, widen it a little — 70 cM or even 50 cM — rather than abandoning the method. Just expect messier results.
What Do You Need Before You Start?
Not much, which is the point.
- A DNA test at any of the major companies. AncestryDNA, 23andMe, MyHeritage, FamilyTreeDNA — all of them have a shared-match feature under some name (Shared Matches, Relatives in Common, In Common With).
- A spreadsheet. Google Sheets, Excel, LibreOffice. Anything with cell fill colors.
- An hour or two. A first pass on 20–30 matches genuinely takes about that.
- No tree required. You can do the whole thing knowing nothing about your family, which is exactly why unknown-parentage searchers use it.
You do not need a chromosome browser, segment data, DNA Painter, a subscription, or any knowledge of centimorgans beyond reading a number off a screen.
How Do You Do the Leeds Method Step by Step?
Here's the full process.
1. Set up the sheet. Column A for the match's name or username, column B for shared cM. Leave columns C onward blank — those become your color columns.
2. Fill in your matches. Work down your match list and add everyone in the 90–400 cM range. Sort by shared cM, highest at the top.
3. Remove known close relatives. Your sibling, your aunt, your first cousin — take them out. You already know how they connect, and they'd bridge clusters.
4. Color your top match. Go to the highest remaining match. Pick a color, fill their cell in column C. Cluster one exists.
5. Open their shared matches. Click through to that person's shared-match list on the testing site. Every name there that also appears in your spreadsheet gets the same color in column C. Ignore names that aren't on your list — you're only clustering the people in your window.
6. Move to the next uncoloured match. Highest one with no color. Move to column D, pick a new color, and repeat step 5.
7. Keep going. Work down until everyone has a color or you've established that they have no shared matches within your list. New column each time you start a fresh group.
8. Look at the shape. Count the columns. Look for anyone colored in two. Look for anyone with no color at all.
9. Name the clusters. Find one person in each column with a public tree you can read. Their surnames and places tell you which of your four lines the whole column belongs to.
Step 9 is where the work pays off. Once a column has a name, every anonymous username in it is suddenly a relative on a known branch.
What Does a Finished Leeds Method Chart Look Like?
Here's a worked example. Say these are your matches in the 90–400 cM range after you've removed known close family:
| Match | Shared cM | Cluster |
|---|---|---|
| Ruth M. | 312 | 🔵 Blue |
| Dennis P. | 268 | 🟡 Yellow |
| Carol T. | 240 | 🔵 Blue |
| Frank L. | 198 | 🟢 Green |
| Helen S. | 176 | 🔴 Red |
| Tony G. | 155 | 🟡 Yellow |
| Marie D. | 141 | 🟢 Green |
| Paul K. | 128 | 🔴 Red |
| Anna B. | 119 | 🔵 Blue |
| Jim R. | 97 | — none — |
Laid out as the actual grid you'd build, it looks like this:
| Match | cM | Col 1 | Col 2 | Col 3 | Col 4 |
|---|---|---|---|---|---|
| Ruth M. | 312 | ● | |||
| Dennis P. | 268 | ● | |||
| Carol T. | 240 | ● | |||
| Frank L. | 198 | ● | |||
| Helen S. | 176 | ● | |||
| Tony G. | 155 | ● | |||
| Marie D. | 141 | ● | |||
| Paul K. | 128 | ● | |||
| Anna B. | 119 | ● | |||
| Jim R. | 97 |
Four clean columns. Ruth, Carol and Anna all match each other, so they're one line. Dennis and Tony are a second. Frank and Marie a third. Helen and Paul a fourth. Jim matches none of them — he might belong to a fifth branch nobody else has tested from, or he might be a more distant connection than his cM suggests.
Now you open trees. Suppose Carol's tree shows the surname Brennan from County Mayo, and you know your father's mother was a Brennan. Column 1 is your paternal grandmother's line — all of it, including Ruth and Anna, whose trees are private and whose usernames are unhelpful. Three matches identified from one tree.
That's the whole trick, and it scales. Every new match you get can be dropped into a cluster in thirty seconds by checking whose shared-match list they appear on.
What If You Get More or Fewer Than Four Clusters?
Four is the textbook result. Real results are messier, and the deviations are informative rather than a failure.
Fewer than four clusters
Almost always means one or more of your grandparents' families haven't tested, or haven't tested in the range you're looking at. If your paternal grandfather came from a family that emigrated and lost touch, or from a country where DNA testing isn't popular, that column may be empty or contain one lonely match.
Try widening the range down to 50 or 60 cM to see if a thin fourth cluster appears. If it doesn't, that's real information: you now know which branch is under-represented in the database, and it tells you where a targeted test — an older relative on that side — would be most valuable.
More than four clusters
Common causes:
- A cluster split in two. If lots of people from one great-grandparent couple tested, they may separate into two sub-groups along their own parents' lines. Look at whether the two extra columns share a few members.
- Half relationships. A half sibling relationship somewhere in the recent tree creates a group that doesn't fit the tidy four-way structure.
- Small orphan clusters. Two or three people who match each other and nobody else. Often a genuine distant branch with poor coverage.
- An unexpected parentage situation. Sometimes clusters don't map onto the grandparents you expected. More on that below.
Clusters that overlap
This is the classic frustration: half your matches end up colored in two or three columns and the clean separation dissolves.
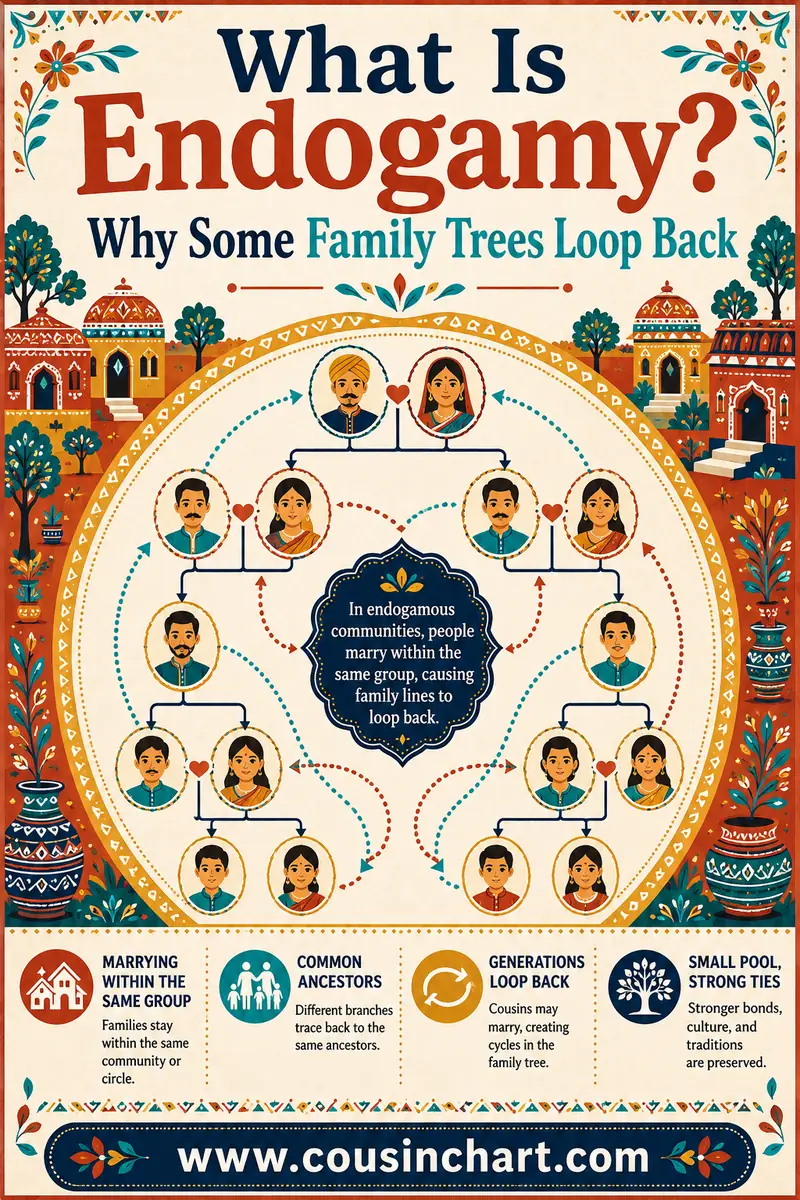
The usual culprit is endogamy — descending from a population where people married within the same community for generations, so everyone is related to everyone else through multiple paths. Ashkenazi Jewish, Acadian, Low German Mennonite, Puerto Rican, and many island and isolated-valley populations all show this. Matches share more DNA than their genealogical relationship suggests and they share it across multiple lines, so clustering blurs. Our endogamy guide explains the mechanism in detail.
The other cause is pedigree collapse — cousins marrying somewhere in your recent tree, which means two of your grandparents' lines are literally the same family further back. Two of your clusters are supposed to merge, because they're genuinely one branch.
What to do about it:
- Raise your lower cutoff. Working from 150 cM up instead of 90 cM cuts a lot of the multi-path noise.
- Accept fewer, larger clusters and treat them as regions rather than precise lines.
- Lean on documented trees more heavily — in endogamous populations, records do the work DNA can't.
- Don't force a match into one column when the evidence says two. Record the ambiguity.
When the clusters don't match the family you expected
Occasionally the four clusters simply don't line up with the four grandparents you grew up with. Perhaps three clusters point clearly at your mother's family and the fourth contains surnames nobody in your family recognises.
That usually means an unexpected parentage event somewhere in the last few generations — an adoption, a misattributed father, a family that had reasons not to discuss something. It's more common than most people assume, and finding it in a spreadsheet is a genuinely disorienting experience.
There's no rushing this. The DNA is telling you something factual about biology, and it isn't telling you anything at all about who raised whom, or who loved whom, or what any of it meant to the people involved. Sit with it before you contact anyone. Talking to someone who's been through it — genetic genealogy support communities exist precisely for this — helps more than another evening of spreadsheets.
Why Does the Leeds Method Work Without a Chromosome Browser?
Because it never asks where you share DNA — only whether two people share it with each other. Shared-match lists answer that question, and every company provides them.
Segment-based techniques like triangulation need to know that three people overlap on the same physical stretch of a chromosome, which requires a browser. As covered in our chromosome browser guide, AncestryDNA doesn't offer one, so those techniques are off the table for the majority of testers unless they transfer their data elsewhere.
The Leeds Method sidesteps the whole issue. It's cruder — you learn which branch, not which ancestor and not which segment — but crude and available beats precise and impossible.
It also pairs well with the segment tools if you do have them. Cluster first to find out which side of the family a match belongs to, then paint their segments in DNA Painter with confidence about maternal versus paternal. Clustering tells you the side; painting tells you the ancestor.
Leeds Method vs AutoClusters: What's the Difference?
AutoClusters is the automated cousin of the Leeds Method. Instead of you clicking through shared-match lists, software does it and hands back a colored grid. MyHeritage has it built in, and Genetic Affairs offers it for several sites.
| Leeds Method | AutoClusters | |
|---|---|---|
| Effort | Manual, an hour or two | Automatic, minutes |
| Cost | Free | Free at MyHeritage; varies elsewhere |
| Works with AncestryDNA | Yes | Depends on the service and its access |
| Typical output | Four grandparent-level clusters | Many smaller clusters, often a dozen or more |
| Control | You choose the cM range and cutoffs | Set by parameters you tweak before running |
| Understanding gained | High — you see every connection form | Lower — you get a finished picture |
They answer slightly different questions. The Leeds Method deliberately targets the grandparent level, producing a small number of big, meaningful groups. AutoClusters usually slices finer, giving you many small clusters that correspond to more distant ancestral couples.
Most experienced researchers use both. Do Leeds by hand once, because building it yourself teaches you how your own match list is shaped, then run AutoClusters for the fine detail.
What Mistakes Should You Avoid?
Including close relatives. The single most common error. Anyone above roughly 400 cM bridges clusters and ruins the separation. Take them out.
Coloring people who aren't on your list. When you open a shared-match list you'll see dozens of names. Only color the ones already in your spreadsheet — otherwise the sheet grows without limit and the clusters never resolve.
Starting from the bottom. Always work from the highest cM downward. Big matches anchor clusters; small ones scatter.
Giving up when it's messy. Overlap and stray matches are normal. A chart with three tidy clusters and six confused rows is still useful.
Not recording your cutoffs. Write down the cM range you used and the date. Your match list grows constantly, and in six months you'll want to know whether a new match fits the same criteria.
Doing it once and stopping. New matches arrive every week. Keep the sheet, add newcomers, and slot them into existing colors. The second year of a Leeds chart is far more valuable than the first.
Using colored dots instead of a spreadsheet without a backup. Ancestry's custom groups (the colored dots on matches) are a convenient way to run the method inside the site itself, and many people prefer them. Just remember they live on Ancestry's servers, the number of groups is capped at a couple of dozen, and you can't see the whole grid at once the way you can in a sheet. Do both if you can.
FAQ
What cM range should I use for the Leeds Method?
Roughly 90 to 400 cM is the standard window. Above 400 cM matches tend to be first cousins or closer, who connect through a whole grandparent couple and therefore appear in two clusters. Below 90 cM the matches get numerous and vague, and Ancestry only shows shared matches down to 20 cM anyway.
Why does the Leeds Method give four clusters?
Because you have four grandparents, and every ancestral line behind you sits behind exactly one of them. Matches in the second-cousin range descend from one great-grandparent couple, so they match everyone else on that line and nobody on the other three — producing four naturally separate groups.
Can I use the Leeds Method with AncestryDNA?
Yes, and it's the main reason the method exists. It needs only a match list and a shared-match feature, both of which Ancestry provides. No chromosome browser or segment data is required, which is what makes it usable by the largest group of testers.
What if my clusters overlap?
Overlap usually means endogamy — ancestry from a community where people married within the same population for generations — or pedigree collapse from cousin marriage in your recent tree. Raise your lower cM cutoff, accept broader clusters, and rely more on documented records for those lines.
Do I need a family tree to use the Leeds Method?
No. You can build the clusters knowing nothing about your family, which is why adoptees and unknown-parentage searchers use it. You only need trees at the final step, when you're identifying which of your matches' clusters belongs to which branch.
Is the Leeds Method the same as AutoClusters?
They share the same logic, but AutoClusters is automated and usually produces many smaller clusters representing more distant ancestral couples. The Leeds Method is manual and deliberately targets the grandparent level, giving four larger groups. Many researchers run both.
Start Sorting, Then Start Naming
The Leeds Method is one of the few genealogy techniques that costs nothing, needs no special tools, and produces a result you can act on the same afternoon. An hour with a spreadsheet turns a wall of anonymous usernames into four organized branches — and every match that arrives afterwards has a place to go.
Before you build the sheet, get comfortable with the numbers you'll be sorting by. Run a few of your matches through the free DNA match calculator to see what each cM total could mean, then read the shared cM chart guide to understand why the 90–400 window is the sweet spot. After that, it's just colors and clicking.