DNA Tests for Hispanic and Latino Ancestry
Start here, because it saves a lot of disappointment: "Hispanic" and "Latino" are not genetic categories, and no test reports them. They describe language, culture and geography across more than twenty countries. What a test actually reports is a mixture — usually some combination of Indigenous American, European and African ancestry, in proportions that vary enormously by country, by region and by individual family. The mixture itself is reliable at that broad level. The fine detail underneath it, especially the Indigenous and Iberian components, is the fuzziest part of any consumer product. For sorting out how a new match connects, the cousin calculator will get you further than the pie chart will.
What are you testing for? Tap the closest match.
Tap an option above. In short: buy the matching, treat the map as background.
Which test should you buy first?
An autosomal test at the company with the biggest matching database, then a free upload of your raw data file to every other site that accepts one.
Autosomal covers all your lines. It matches you against every other tester in that pool, which is what finds living cousins. Y-DNA and mtDNA each cover a single line and are poor first purchases.
Database size is the deciding feature. The largest US database is where most Mexican American, Puerto Rican and Cuban American testers already are. A rival's slightly different regional map does not compensate for missing the cousin who has your great-grandmother's baptism record.
International reach matters if your family is still abroad. One major company has a noticeably stronger presence outside the United States, which can be the difference between matching relatives in Jalisco and matching only relatives in Chicago. The trade-offs are compared in the three-way comparison of Ancestry, 23andMe and MyHeritage.
Then upload for free. Downloading your raw file and uploading it elsewhere puts you in extra match pools at no cost. It is the single best-value action available after the first kit.
Why is "Hispanic" not a DNA category?
Because it describes a shared colonial language history, not a shared genetic history.
Twenty-plus countries, three continents of ancestry. A person from Argentina, one from the Dominican Republic and one from Guatemala may share almost nothing genetically while sharing a language and much of a culture.
Mixture is the norm, not the exception. Most Latin American populations formed from Indigenous American, European and African ancestry in different proportions, over roughly five centuries. The pie chart is showing you that history.
Regional variation within a country is large. Northern and southern Mexico differ. Coastal and highland Peru differ. A national label flattens all of it.
And individual variation is larger still. Full siblings inherit different halves from each parent, so two siblings from the same family can report noticeably different percentages. Neither is wrong.
What will your results typically show?
The table below gives the broad pattern reported in population studies by country of origin. Treat it as orientation only — these are population averages, and any individual can fall far outside them.
| Country of origin | Typically largest component | Usually present | Often small or absent |
|---|---|---|---|
| Mexico | Indigenous American and European, both substantial | Iberian European | African, usually small |
| Guatemala | Indigenous American, often dominant | Iberian European | African |
| Puerto Rico | European, with real Indigenous and African shares | African, Indigenous Taíno-related | — |
| Dominican Republic | European and African, both large | Indigenous American, small | — |
| Cuba | European | African | Indigenous American, small |
| Colombia | European | Indigenous American, African | — |
| Argentina and Uruguay | European, often dominant | Indigenous American, small | African, small |
| Peru and Bolivia | Indigenous American, often dominant | Iberian European | African |
Do not read a row as a prediction. It is a summary of averages across a population, and your own family may have moved, married in or married out in ways the average knows nothing about.
The three-way split is the trustworthy part. Whether your ancestry is mostly Indigenous, mostly European or a balance of both is a call panels make reliably. The subdivisions inside each are far less certain.
Why is the Indigenous portion the least precise part?
Because the reference data is thin, and for reasons that are not the companies' to fix alone.
Panels need participants. Resolving Indigenous American ancestry into regions or peoples would require large numbers of volunteers with documented deep roots in specific communities. Many communities have declined, after a long history of research done to them rather than with them, and that decision deserves respect.
So the category stays broad. Most products report Indigenous Americas at a continental or large-regional level. No commercial test identifies a tribe, and no result of any size supports enrolment in a nation — a point set out fully in the guide to Native American DNA testing.
Small percentages are the least stable of all. A 2% Indigenous figure sits near the limit of what a model can distinguish from noise, and figures that small appear and disappear across updates more than any other category.
A zero does not disprove a documented ancestor. Autosomal DNA from any one ancestor halves each generation and is inherited at random, so beyond about five or six generations you may carry nothing measurable from that person.
Why do Spain and Portugal blur together?
Because they are genetically close, and closeness is exactly what these models struggle with.
Neighboring populations overlap. Iberian populations have intermarried across the peninsula for centuries. Splitting Spanish from Portuguese ancestry — let alone Galician from Andalusian — asks a statistical model to draw a line where the data barely has one.
Companies draw the regions differently. One product's "Spain" and another's "Portugal" are not the same shape, which is a large part of why two kits give you different numbers. The general explanation is in the guide to ethnicity estimate accuracy.
Sephardic ancestry adds a further layer. Many Latin American families carry documented or suspected converso ancestry, and consumer panels handle that unevenly. A result here is a lead worth researching, not a conclusion.
Surname evidence is often sharper than the estimate. Spanish naming conventions preserve two family lines per generation, which is a genuine research advantage — the guide to Spanish surnames and their origins covers what a name can and cannot indicate.
Does endogamy distort your match list?
In several Latin American populations, yes — and it is the most common reason people misread their results.
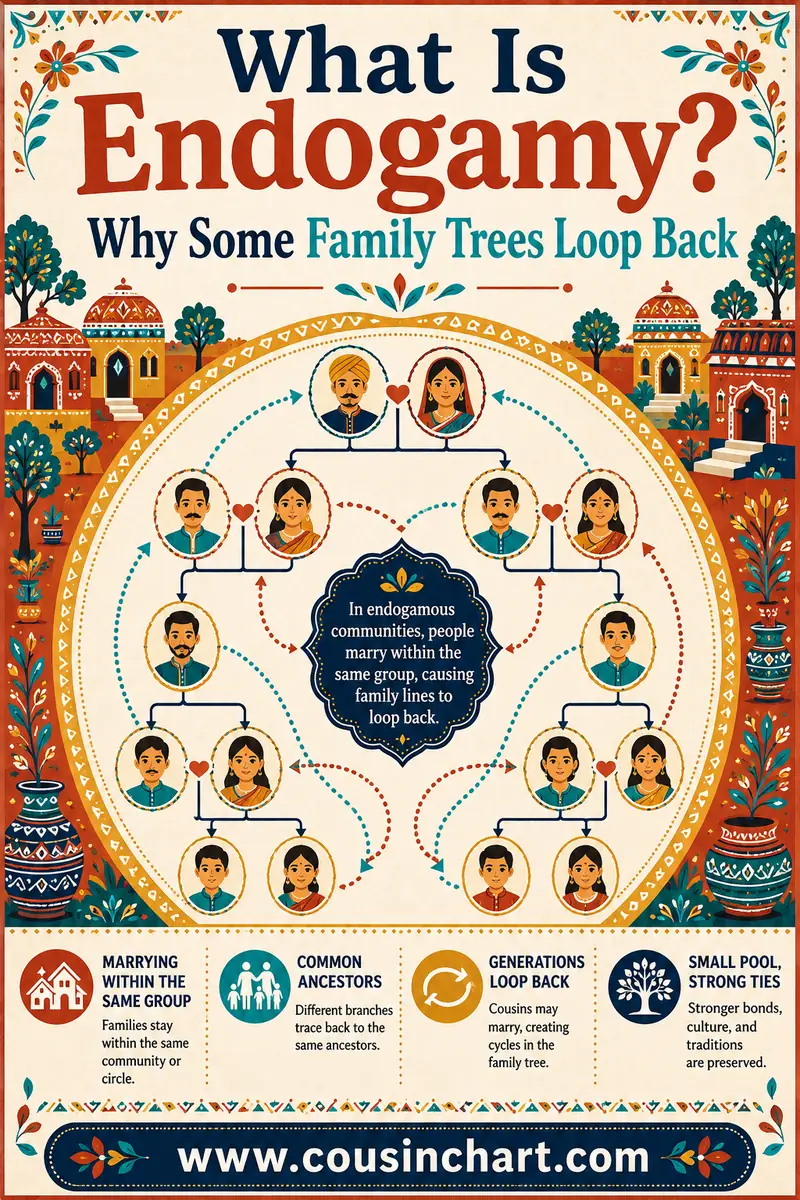
Endogamy means marrying within a small pool over many generations. Islands and isolated colonial settlements produce it naturally. Puerto Rico and colonial New Mexico are frequently cited examples, and there are many others.
It inflates shared centimorgans. When you and a match are related through several lines at once, your shared total adds up across all of them. A pair of third cousins can therefore share as much DNA as second cousins normally would.
So the standard charts read one step too close. In an endogamous line, treat a predicted relationship as the closest possibility rather than the likely one, and expect the true connection to be further out. The mechanics are explained in the guide to what endogamy is.
Shared matches and documented trees settle it. Where the number is ambiguous, the answer comes from who else the match matches and from parish records — not from the cM figure alone. Feed the number into the DNA match calculator to see the full range of relationships it fits.
When do the records beat the test?
More often than people expect, because Latin American record-keeping is genuinely excellent.
Catholic parish registers go back centuries. Baptisms, marriages and burials were recorded systematically from the sixteenth century in much of Spanish America, and entries frequently name parents, grandparents and godparents.
Civil registration adds another layer. Mexico introduced civil registration from 1859 and Puerto Rico from the 1880s, giving a second, independent record set for the same families.
Much of it is free to search. FamilySearch has digitized enormous quantities of Latin American parish and civil registration, and the practical routes into the Mexican material are covered in the guide to Mexican genealogy records.
Records name people; DNA does not. A baptism entry gives you a person, a date and two parents. A percentage gives you a region and a probability. Where both exist, use the register.
How do you get the most from one kit?
Sequence the spending and the effort, rather than buying more features.
Test the oldest generation first. A grandparent's kit contains DNA you have already lost, and it splits your match list by generation in a way that makes everything easier to interpret.
Upload the raw file everywhere free. More pools, no extra cost, more cousins in countries where fewer people have tested.
Group matches before you chase them. Sorting your list by shared matches reveals family clusters faster than reading trees one by one.
Write down what the family already says. Villages, surnames, migration years, the parish everyone was baptised in. That is what turns a match list into a tree, and it is free.
FAQ
What is the best DNA test for Hispanic ancestry?
An autosomal test at the company with the largest matching database, followed by free uploads of your raw file to other sites. Match lists find living relatives; ethnicity estimates report only broad Indigenous American, European and African components with limited detail underneath.
Why does my DNA say Indigenous American but not name a tribe?
Reference panels for Indigenous American ancestry are thin, because many communities have declined to participate in genetic research. Consumer tests therefore report the category at a continental or large-regional level only. No commercial test identifies a specific tribe or supports tribal enrolment.
Why do Spain and Portugal show up together in my results?
Iberian populations are genetically very close after centuries of intermarriage, so separating Spanish from Portuguese ancestry pushes a statistical model past what the data supports. Companies also draw the regions differently, which is why two kits give you different Iberian numbers.
Why do my matches look closer than they should be?
You may descend from an endogamous population, such as Puerto Rico or colonial New Mexico, where families intermarried within a small pool for generations. Being related through several lines at once inflates the shared centimorgan total, so predicted relationships read roughly one step too close.
Should Latino families test or research records first?
Do both, but do not skip the records. Catholic parish registers from the sixteenth century and civil registration from the mid-nineteenth are extensive and largely free to search on FamilySearch. They name individuals, which no ethnicity estimate can do.
Will my siblings get the same percentages as me?
No. Each child inherits a different random half of each parent's DNA, so full siblings routinely differ by several percentage points in every category, and one may show a small component the other lacks entirely. Both results are correct.
Use the matches, read the map lightly
The useful half of a test for Hispanic and Latino ancestry is the match list, and the decorative half is the percentages. Buy one autosomal kit at the largest database, upload the raw file free everywhere else, and spend your next budget on an older relative rather than an upgrade. Expect a three-way mixture, expect the Indigenous and Iberian detail to stay fuzzy, and expect endogamy to make some matches read closer than they are. Then go to the parish registers, which will name the people the percentages never can. When a promising match turns up, the cousin calculator will show you how the two of you fit together.