How Much DNA Do Cousins Share?
First cousins share around 850 centimorgans on average, second cousins around 230, third cousins around 75, and fourth cousins around 35 — but the averages are the least useful part of the answer. What matters is the range, because two people in the same relationship can share wildly different amounts, and the ranges for different relationships overlap heavily. A 200 cM match might be a second cousin, a first cousin twice removed, a half first cousin, or a great-great-aunt. This page gives the numbers, explains why they vary so much, and shows how to distinguish between relationships that look identical on paper. Run your own figure through the DNA match calculator for the probabilities.
What Are the Expected Amounts?
Figures are total shared centimorgans, based on the large crowd-sourced datasets the genealogy community has built up.
| Relationship | Average cM | Typical range |
|---|---|---|
| Parent / child | 3,485 | 3,330–3,720 |
| Full sibling | 2,613 | 2,209–3,384 |
| Grandparent / grandchild | 1,754 | 1,156–2,311 |
| Aunt / uncle, niece / nephew | 1,740 | 1,201–2,282 |
| Half sibling | 1,759 | 1,160–2,436 |
| First cousin | 866 | 396–1,397 |
| First cousin once removed | 433 | 102–980 |
| Half first cousin | 449 | 156–979 |
| Great-aunt / great-uncle | 850 | 251–2,108 |
| Second cousin | 229 | 41–592 |
| Second cousin once removed | 122 | 14–353 |
| Half second cousin | 120 | 9–397 |
| Third cousin | 73 | 0–234 |
| Third cousin once removed | 48 | 0–192 |
| Fourth cousin | 35 | 0–139 |
| Fifth cousin | 25 | 0–117 |
| Sixth cousin | 18 | 0–71 |
Two things jump out. The ranges are enormous — first cousins range from under 400 to nearly 1,400 cM. And the ranges overlap: a 400 cM match could be a first cousin at the low end or a first cousin once removed at the high end.
From third cousins outward, the low end reaches zero. Roughly 10% of third cousins share no detectable DNA at all, rising to about 50% for fourth cousins. Genuine relatives frequently don't appear as matches — see why don't I match a known relative.
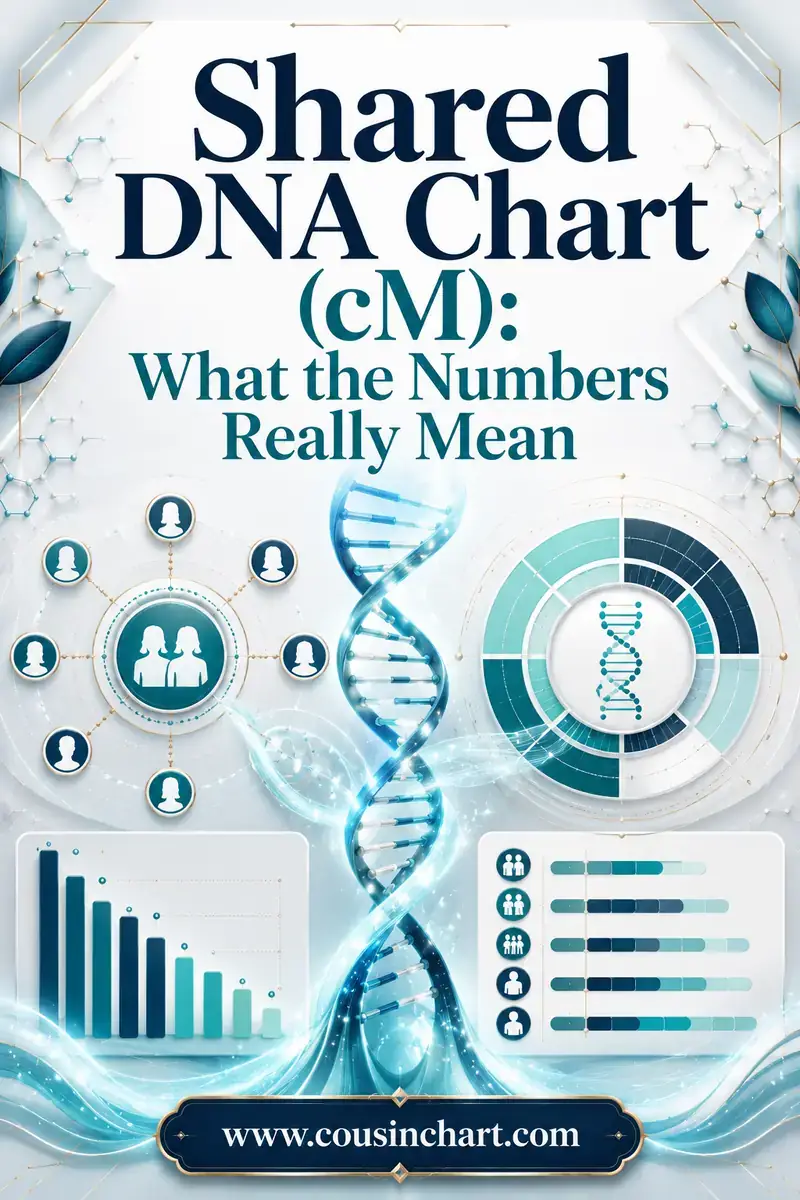
If centimorgans themselves are unfamiliar, centimorgans explained covers the unit, and the shared cM chart gives the full reference version of this table.
Why Is the Variation So Large?
Because inheritance beyond your parents is random.
You get exactly 50% from each parent. That's fixed, and it's why parent-child matches are so consistent.
Everything beyond that is a lottery. You get roughly 25% from each grandparent, but "roughly" does real work — the actual figure varies by several percentage points either way. By the great-grandparent generation the variation is substantial, and further back some ancestors contribute nothing at all.
The mechanism is recombination. When your parents' cells formed the egg and sperm that made you, their chromosome pairs shuffled — but only at a limited number of crossover points, perhaps 30 to 40 across the genome. With so few shuffles, chance plays a large role in which chunks get passed on.
Consequences worth knowing:
- Full siblings share about 50% on average, but anywhere from 38% to 61%. Two siblings can have noticeably different amounts of DNA in common with the same cousin
- You can share more DNA with one first cousin than another, even though both are the same relationship
- Distant cousins may share nothing. Beyond fourth cousins, most genuine relatives are invisible to testing
- Half relationships share roughly half what full ones do, but the ranges overlap so heavily that cM alone rarely distinguishes them
The practical rule: treat any single shared amount as evidence, not proof. A number narrows the field of possible relationships; it almost never identifies one.
Where Do These Numbers Come From?
Worth knowing, because it explains both why the ranges are trustworthy and where they stop being reliable.
The figures are crowd-sourced. The Shared cM Project collected tens of thousands of submissions from people with documented, paper-trail-confirmed relationships, then recorded what each pair actually shared. That's why the ranges are empirical rather than theoretical — they describe what really happens rather than what the mathematics predicts.
Theory and observation don't quite agree. Simple genetics says first cousins share 12.5%, or about 890 cM. Observation says the average is close to that but the spread is far wider than a naive model suggests, because recombination happens at a limited number of crossover points rather than smoothly.
Sample sizes vary by relationship. Close relationships have thousands of data points and very reliable ranges. Fifth and sixth cousins have far fewer confirmed submissions, and the figures there should be treated as indicative.
Company algorithms differ. Each testing service applies its own matching thresholds and handling of small segments, so the same two people can show slightly different totals at different companies. Differences of a few percent are normal; large discrepancies usually mean one site is including small segments the other filters out.
The charts assume no endogamy and no double relationships. Both inflate the totals, and neither is unusual — which is why the numbers should always be read alongside what you know about the family rather than in isolation.
How Do You Tell Similar Relationships Apart?
The real work, and it uses everything except the cM figure.
Age and generation. A 900 cM match who is eighty years old is far more likely to be a great-aunt than a first cousin your own age. Ages exclude possibilities quickly.
Shared matches. Which cluster does the match fall into? Which side of your family? A single anchor relative can resolve an ambiguous number instantly — see what are shared DNA matches.
X-DNA. If you share X-DNA, entire ancestral paths are excluded, and that sometimes eliminates one of two candidate relationships outright. X-DNA inheritance explained covers the rule.
Number and size of segments. Closer relationships tend to have more segments and larger ones. Two matches sharing 200 cM look different if one is a single 200 cM segment and the other is fifteen small ones — the second pattern suggests a more distant or multiple connection.
Triangulation. Confirming that you and two matches share the same segment tells you the connection is genuinely through one common ancestral line — see what are triangulated groups.
Trees and documents. In the end, DNA suggests and records confirm. A shared surname in the right place at the right time, plus a plausible cM figure and a matching cluster, is what an identification is actually built from.
Probability tools. The community-built calculators give the likelihood of each candidate relationship for a given amount, which is far more honest than a single answer — that's what the DNA match calculator is for.
What Do Removed and Half Relationships Do to the Numbers?
Two modifiers that account for a great deal of confusion.
"Removed" means a generation difference. Your first cousin's child is your first cousin once removed. Each removal roughly halves the expected shared DNA:
| Relationship | Average cM |
|---|---|
| First cousin | 866 |
| First cousin once removed | 433 |
| First cousin twice removed | 221 |
| First cousin three times removed | 123 |
"Half" means one shared ancestor instead of two. Half first cousins descend from one common grandparent rather than a couple, and share roughly half what full first cousins do — around 449 cM against 866.
The awkward consequence: a half relationship and a once-removed relationship of the same degree produce very similar amounts. A half first cousin averages 449 cM; a first cousin once removed averages 433. Centimorgans cannot separate them. Age, shared matches and documented trees can.
Double cousins — where two siblings from one family married two siblings from another — share about twice the usual amount, since they're related through both sets of grandparents. Double first cousins typically share around 1,300 cM, which reads as a much closer relationship than it is.
Adoption and unknown parentage cases are where these numbers do the most work, because the shared amount is often the first solid fact available. A 1,700 cM match narrows to grandparent, aunt, uncle or half sibling — four possibilities, and ages usually resolve which. Working outward from one strong match with a known relationship is the standard method, and it depends entirely on reading the cM figure correctly.
Endogamy inflates everything. In populations that intermarried over generations, people share DNA through many distant paths at once, so totals overstate closeness considerably. Standard charts need adjusting downward, sometimes substantially, and multiple small segments are the giveaway.
How Should You Read a Match in Practice?
A worked approach, using a real-feeling example.
Say you have a match at 340 cM. The chart gives you a long list of candidates: first cousin once removed, half first cousin, second cousin, great-great-aunt, half great-aunt, first cousin twice removed. Six possibilities, all plausible.
Start with age. If the match was born in 1948 and you were born in 1985, a second cousin your own age is unlikely and a first cousin once removed is a strong candidate. Generation gaps do more work than any other single clue.
Then shared matches. If they cluster with your confirmed maternal grandmother's line, three of the six candidates disappear immediately, because they'd have to be on other branches.
Then segment structure. Three large segments looks different from twenty small ones. Many small segments suggest either a distant relationship, endogamy, or multiple connections rather than one clean line.
Then the tree. Once you know the branch and the approximate generation, look at who's actually there. Frequently there's only one person of the right age in the right family, and the identification follows.
Then confirm. A document, a photograph, a family memory, or agreement from the match themselves. DNA plus a plausible tree is a hypothesis; a record makes it a conclusion.
And record your reasoning, not just the answer. Six months later you won't remember why you ruled out the half first cousin, and someone else reading your tree certainly won't.
Frequently Asked Questions
How much DNA do first cousins share?
First cousins share around 866 centimorgans on average, with a typical range of roughly 396 to 1,397. The range is wide because inheritance beyond your parents is random, so two people in the same relationship can share very different amounts.
How much DNA do second cousins share?
Around 229 cM on average, with a range of roughly 41 to 592. That range overlaps with first cousins once removed at the top and third cousins at the bottom, so the number alone rarely settles the relationship.
Can cousins share no DNA at all?
Yes, from third cousins outward. About 10% of third cousins share no detectable DNA, rising to roughly half of fourth cousins. Absence of a match is not evidence that two people aren't related.
Why do I share more DNA with one cousin than another?
Because recombination is random. You inherit exactly half your DNA from each parent, but which particular half is chance, so the amount you share with different cousins of the same degree varies considerably.
How can I tell a half cousin from a cousin once removed?
Not from centimorgans — a half first cousin averages 449 cM and a first cousin once removed averages 433, which is indistinguishable. Use ages, shared matches, X-DNA where relevant, and documented trees instead.
Do siblings share exactly 50% of their DNA?
On average yes, but the actual figure ranges from about 38% to 61%. That's why two full siblings can show noticeably different amounts of shared DNA with the same cousin, and why testing more than one sibling is genuinely useful.
One habit worth adopting: write the shared amount down next to every match you identify, along with the relationship you concluded. Over time you build your own reference set for your own family, and when an ambiguous match appears you can compare against confirmed relationships in the same lines rather than against a general chart.
Use the averages to orient yourself and the ranges to stay honest. A shared amount narrows the possibilities and rarely settles them — ages, clusters and documents do that. Where the number matters most is in ruling relationships out, which is usually enough to point you at the right branch. Check the probabilities for your own figure with the DNA match calculator.