Centimorgans Explained: What a cM Really Measures
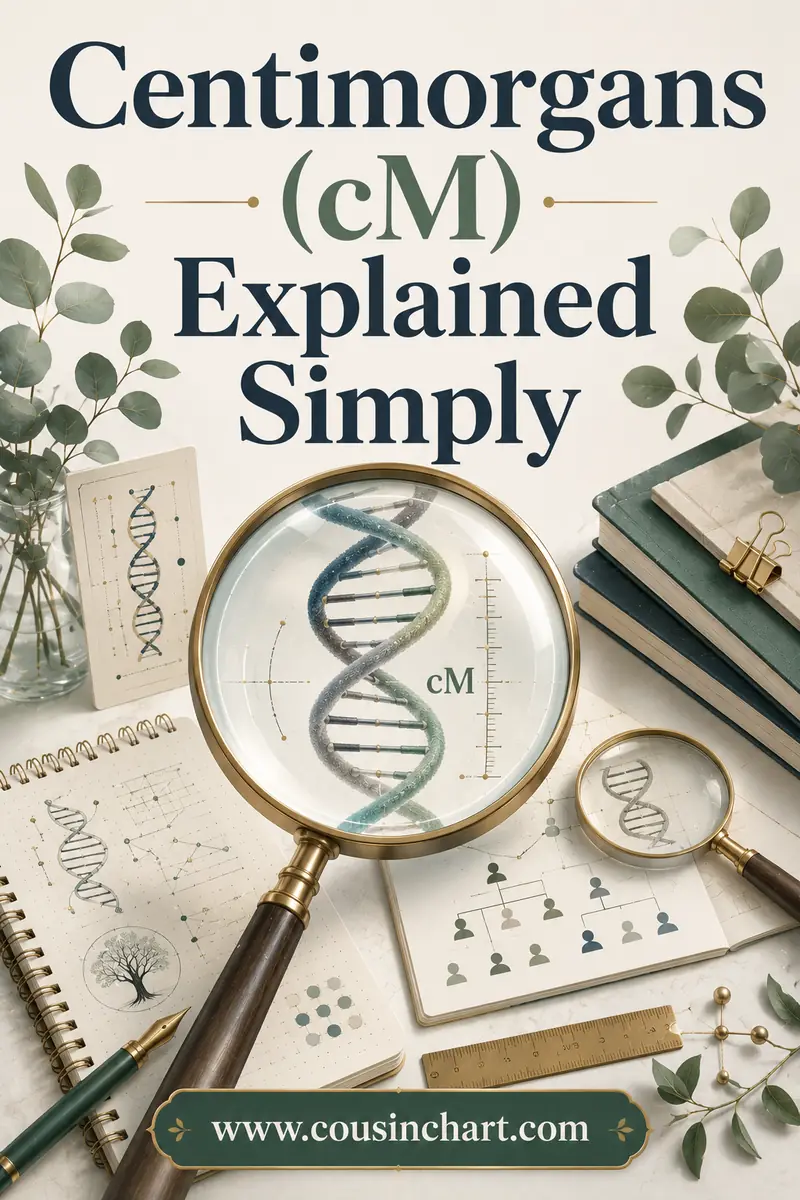
A centimorgan (cM) is a unit of genetic distance — it measures how likely two spots on a chromosome are to be split apart when DNA is shuffled and passed to the next generation. Two points 1 cM apart have roughly a 1% chance of being separated in any single generation. It is not a percentage of your DNA, not a physical length, and not a count of anything you could see under a microscope.
DNA testing companies use it as a convenient yardstick for shared DNA because the human autosomal genome contains about 6,800 cM in total, so "you and this person share 850 cM" instantly tells an experienced eye roughly how close the relationship is. If you've got a number in front of you right now, our shared cM / DNA match calculator will turn it into a list of the relationships that actually fit.
How many centimorgans should a relative share? Tap a relationship:
Tap a relationship above.
Look up your own cM number →What a Centimorgan Actually Measures
The unit is named after Thomas Hunt Morgan, the geneticist whose fruit-fly work in the early 1900s established that genes sit in a linear order along chromosomes. One morgan is the distance across which one crossover event is expected per generation; a centimorgan is one hundredth of that, so 1 cM corresponds to about a 1% chance of a crossover falling between two points in a single generation.
Here's what that means in practice. When your body makes egg or sperm cells, the pair of chromosomes you inherited from your own mother and father don't get passed on whole. They swap material first, in a process called recombination, producing a new chromosome that's a patchwork of both. Centimorgans measure how far apart two spots are in terms of how often that swap lands between them.
So the unit describes behavior, not size. Two markers that are almost never separated are close in cM. Two markers that get split half the time are far apart in cM, no matter how many physical letters of DNA sit between them.
Genetic distance vs physical distance
Physical distance is counted in base pairs — the actual A, C, G and T letters. Genetic distance is counted in centimorgans. They correlate loosely: across the human genome, 1 cM averages roughly one million base pairs. But recombination isn't evenly spread. There are hotspots where crossovers happen constantly and cold regions near the centromeres where they almost never do, so a stretch of DNA can be physically long and genetically short, or the reverse.
That's why two matches with the same number of shared base pairs can report different cM totals. The cM figure is weighted by how much genealogical information the region carries, which is exactly what you want for family research.
Why a Centimorgan Isn't a Percentage
People often use "cM" and "percent shared" interchangeably, and mostly get away with it, but they're different things and the difference occasionally matters.
A percentage is a share of a total. A centimorgan is a distance. You can convert between them because the total is roughly known: the 22 pairs of autosomes contain about 6,800 cM, and adding the X chromosome takes the working total closer to 7,400 cM depending on whose map you use. Divide a shared cM figure by that total and you get an approximate percentage.
- 3,400 cM ÷ 6,800 = 50% (parent/child)
- 850 cM ÷ 6,800 ≈ 12.5% (first cousin average)
- 230 cM ÷ 6,800 ≈ 3.4% (second cousin average)
Two catches. First, different reference maps give slightly different totals, so percentages converted from cM are approximations, not exact. Second, 23andMe reports percentages while most other companies report centimorgans, so comparing across sites means converting — multiply a 23andMe percentage by roughly 74 to estimate cM. The company's own documentation explains its method, and our look at how accurate 23andMe is covers where its numbers sit relative to the others.
Typical cM Totals by Relationship
These figures come from the Shared cM Project, the crowdsourced dataset assembled by genealogist Blaine Bettinger from tens of thousands of submitted, documented relationships and published as an interactive tool at DNA Painter. It's the community standard because it reflects what real testers actually report, not just theoretical expectation.
| Relationship | Expected % | Average cM | Typical cM range |
|---|---|---|---|
| Parent / child | 50% | ~3,400+ | Essentially fixed |
| Full sibling | 50% | ~2,600 | 2,300–3,400 |
| Grandparent / grandchild | 25% | ~1,750 | 1,300–2,300 |
| Aunt / uncle, niece / nephew | 25% | ~1,750 | 1,300–2,300 |
| Half sibling | 25% | ~1,750 | 1,300–2,300 |
| Great-grandparent | 12.5% | ~880 | 450–1,300 |
| First cousin | 12.5% | ~850 | 550–1,300 |
| Half first cousin | 6.25% | ~450 | 150–650 |
| First cousin once removed | 6.25% | ~430 | 200–650 |
| Second cousin | 3.125% | ~230 | 75–360 |
| Second cousin once removed | 1.5% | ~120 | 25–230 |
| Third cousin | 0.78% | ~75 | 0–220 |
| Fourth cousin | 0.195% | ~35 | 0–125 |
Look at the third column and the fourth column together and the whole point of this article appears: averages are tidy and reality is wide. The average first cousin shares 850 cM, but a real first cousin can show up anywhere from about 550 to 1,300. That spread is why a cM number is a shortlist generator, never a verdict.
Total cM vs Longest Segment
Your match list reports at least two numbers, and they answer different questions.
Total shared cM answers "how much DNA do we have in common?" It's the sum of every shared segment and it drives the relationship prediction.
Longest segment answers "how recently did we share an ancestor?" Segments get chopped shorter with every generation of inheritance, so a big unbroken block is a signature of a recent connection. A single 70 cM segment says something a pile of 8 cM fragments never will.
Use them together. If a match shows 120 cM total with a 62 cM longest segment, you're looking at a genuine, findable relationship — probably in the second-cousin family. If a match shows 120 cM total with a 9 cM longest segment, the connection is either much older than the total suggests or partly artefactual, and you should treat the prediction with real caution.
A related check: segment count. Close relatives share fewer, larger segments. Distant relatives and endogamous matches share many small ones. If the arithmetic looks odd, look at the shape of the sharing, not just the sum. Companies with a chromosome browser let you see exactly where those segments sit, which is the difference between reading a summary and reading the evidence.
Why Two Siblings Get Different Numbers
This is the single most common "is my test broken?" question, and the answer is reassuring: no, that's how inheritance works.
You inherit exactly 50% of your autosomal DNA from each parent — that part is fixed. But which 50% is randomised by recombination, and your sibling got a different random half. On average, full siblings end up sharing about half of their DNA with each other, but the actual figure swings between roughly 2,300 and 3,400 cM.
The consequences ripple outward:
- Your cousins share different amounts with each of your siblings. Your brother might share 1,050 cM with a first cousin while you share 720 cM with the same person.
- Your siblings have matches you don't have. Segments you didn't inherit still live in them. Testing a sibling is one of the cheapest ways to surface new distant cousins.
- Grandparent-level DNA is uneven. You don't carry 25% from each grandparent exactly; it's about 25% on average, with real variation, and a few generations further back it's entirely possible to carry no measurable DNA from a given ancestor at all.
That last fact bends people's brains, and it's true. Go back nine or ten generations and you have more ancestors than you have segments of DNA to represent them. Everyone in your tree is genuinely your ancestor; not all of them left a genetic trace — a point our piece on why we're all cousins takes further.
Why the Same Pair Gets Different cM at Different Companies
Upload the same two kits to different sites and the shared cM totals won't match exactly. Nothing is broken; the companies make different choices.
Matching thresholds differ. Each company decides the smallest segment worth reporting. Ancestry uses an 8 cM floor for match inclusion; others report down to 6 cM or lower. Lower floors mean higher totals for distant matches — and more false positives.
Algorithms filter differently. AncestryDNA applies a step called Timber that down-weights or removes segments in regions where an implausible number of people match each other. It reduces noise, and it also makes Ancestry's distant-match totals read a little lower than the same comparison at MyHeritage or FamilyTreeDNA.
Reference maps differ. Converting physical positions into centimorgans requires a genetic map, and there's more than one in use. Small differences in the map produce small differences in the reported cM.
Some companies stitch, some don't. Imputation and segment-stitching decisions affect whether two adjacent near-matches get counted as one longer segment or two short ones.
Practical takeaway: don't chase a 15 cM discrepancy between sites. Compare like with like, and when you're weighing a relationship hypothesis, use the ranges rather than treating any single company's number as the truth.
Does the X Chromosome Count in Your Total?
Usually not, and the exception is worth knowing about.
The shared cM totals you see on a match list normally cover the 22 pairs of autosomes only — the chromosomes that aren't the sex chromosomes. That's about 6,800 cM of material, and it's what every relationship range in the Shared cM Project is based on. Keeping the X out is deliberate, because X inheritance follows different rules and would distort the comparison.
The X chromosome adds roughly another 180 to 200 cM, and companies that report it (23andMe, FamilyTreeDNA and GEDmatch) usually show it as a separate line rather than folding it into the main figure. AncestryDNA doesn't report X matching at all.
Why bother with it? Because X inheritance is restricted in a way that's genealogically useful. A man inherits his single X only from his mother, so he can have no X match through his father's father's line at all. A woman gets one X from each parent. Map those constraints onto a family tree and an X match immediately eliminates a whole set of possible paths — which is exactly the kind of elimination that turns a wide list of candidates into a short one.
The catch: X segments recombine less often than autosomal ones, so an X match can persist much further back than its size suggests. Use it to rule paths out, not to estimate how close a relationship is.
What Inflates a cM Total
Several real-world situations push shared DNA above what a relationship "should" show, and each one has a different fix.
Endogamy. When a community married within itself for many generations, distant relatives share DNA through dozens of small, ancient connections in addition to any recent one. Totals run high, predicted relationships come back too close, and small segments are especially untrustworthy. Ashkenazi Jewish, Acadian, Mennonite, Amish, and various island and isolated rural populations all show this pattern.
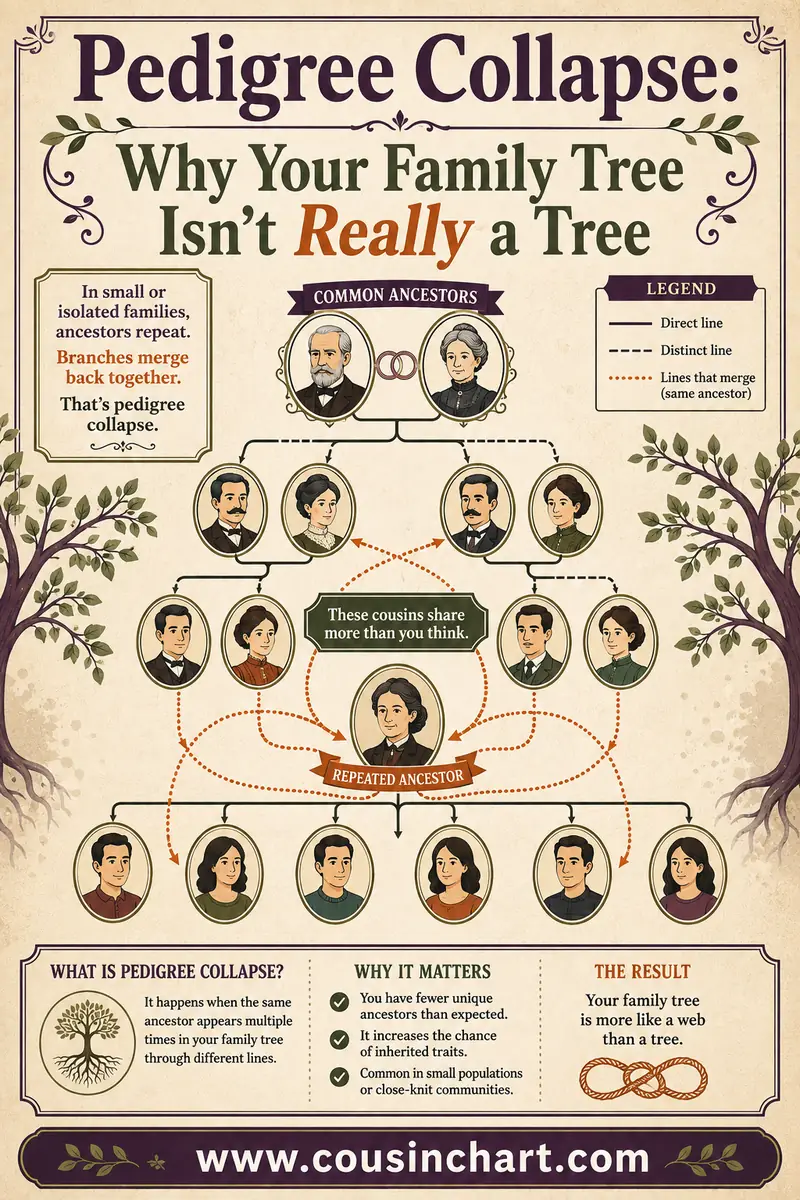
Pedigree collapse. If cousins married anywhere in the recent tree, you and a match may be related along two paths at once, and the shared DNA from both adds together. A "first cousin once removed" reading can really be two separate second-cousin relationships stacking up — the mechanics are laid out in our pedigree collapse guide.
Double relationships. Two siblings marrying two siblings produces double first cousins, who share about 25% rather than 12.5% — the same total as a half sibling. The number is real; the label the company applies to it is wrong.
Small-segment noise. Below about 8 cM, a meaningful share of reported segments aren't inherited from a recent shared ancestor at all. If a total is made up mostly of tiny segments, discount it.
How to Use a cM Number Properly
- Record both numbers — total shared cM and longest segment.
- Generate the full list of possibilities, not just the company's top guess. Every cM figure fits several relationships.
- Cut the list with ages. Birth years eliminate whole generations of options in one move.
- Cut it further with shared matches. Which side of your family does this person cluster with?
- Test the surviving hypothesis against documents. DNA points; records prove.
- Expect a range, not a certainty. If two relationships both remain plausible, say so in your notes instead of picking the prettier one.
There's also a sanity check worth running before you get attached to any theory: does the number make sense in both directions? If you think a match is your first cousin once removed, ask what that implies about their other matches. They should share around 850 cM with one of your parents, and roughly 1,750 cM with the relevant aunt or uncle if that person has tested. Predictions that only work from one side of the family are usually wrong.
The one habit that separates people who get answers from people who go in circles: write down what the number rules out. Elimination is faster than identification, and cM ranges are very good at elimination even when they're poor at pinpointing. Our walkthrough of the shared cM chart shows this process on a real grid, and the same logic underpins reading your whole match list.
FAQ
What is a centimorgan in simple terms?
A centimorgan is a unit measuring genetic distance — how likely two spots on a chromosome are to be separated when DNA is shuffled between generations. Testing companies use it to describe how much DNA two people share. Humans have about 6,800 cM of autosomal DNA in total, so shared cM works as a practical measure of closeness.
Is a centimorgan a percentage?
No. A centimorgan is a distance, not a proportion, though you can convert between them. Divide shared cM by roughly 6,800 to estimate the percentage of DNA shared. 23andMe reports percentages instead of cM; multiplying a 23andMe percentage by about 74 gives an approximate cM figure.
How many centimorgans do first cousins share?
First cousins share about 850 cM on average, with a typical range of roughly 550 to 1,300 cM — around 12.5% of their DNA. That range overlaps with great-grandparents at the top end and first cousins once removed at the bottom, so the number alone doesn't confirm the relationship.
Why do my siblings share different cM with the same cousin?
Because each sibling inherited a different random half of each parent's DNA. You and your sibling share about 50% of your DNA with each other, not 100%, so you each carry cousin segments the other doesn't. Differences of several hundred cM between siblings and the same cousin are completely normal.
What is a good longest segment?
For confident work, a longest segment of 20 cM or more suggests a real, reasonably recent connection. Segments above 40 cM are strong evidence. When the longest segment is under 10 cM, the match may be coincidental or connect through ancestry too distant to trace with records.
Why is my cM total different at Ancestry and MyHeritage?
The companies use different minimum thresholds, different genetic maps, and different filtering algorithms. AncestryDNA's Timber filter removes segments in over-matched regions, which typically lowers its totals for distant matches. Differences of a few percent between sites are expected and not a sign of error.
Turn Your Number Into an Answer
Centimorgans stop being intimidating once you see what they are: a distance measurement borrowed from classical genetics and repurposed as a family-closeness yardstick. Big total, close relative. Big longest segment, recent connection. Wide ranges, several possible answers.
Got a number and want to know what it could mean? Run it through our free DNA match calculator — enter the shared cM and you'll get every relationship that genuinely fits, so you know exactly which possibilities to investigate next.