AutoClusters Explained: How Automated DNA Match Clustering Works
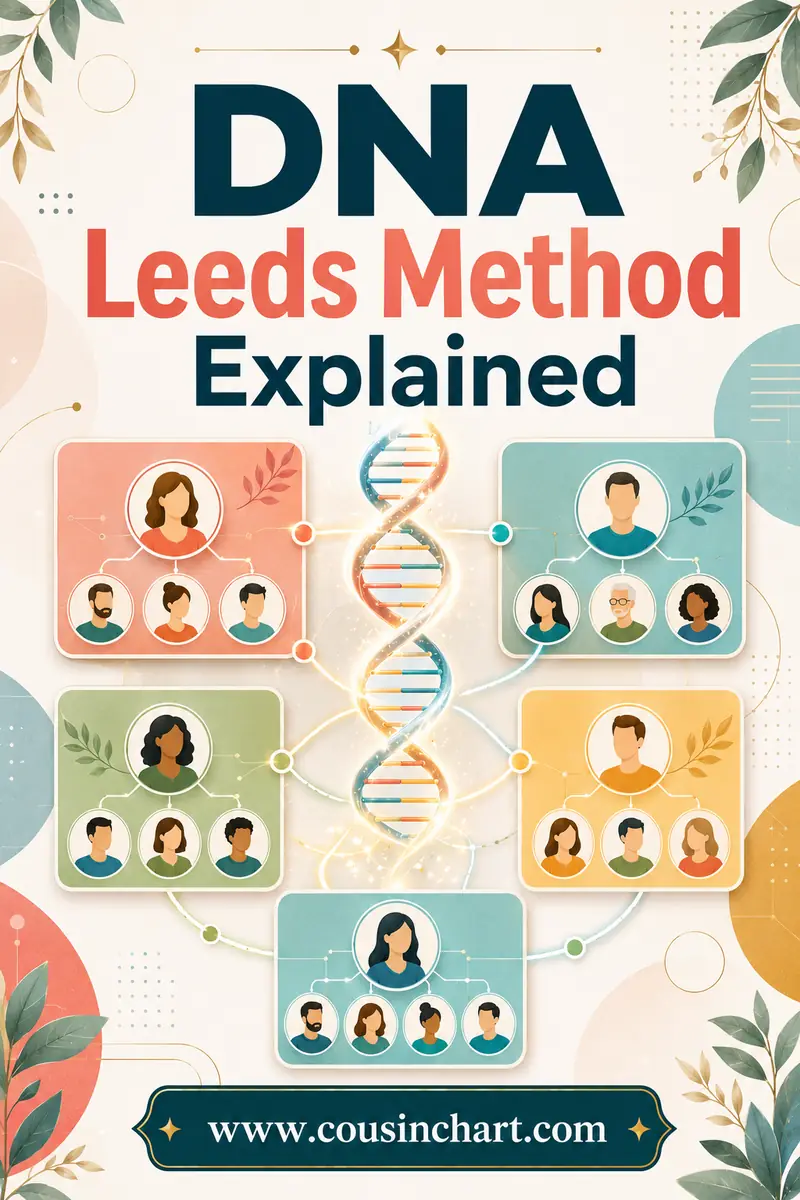
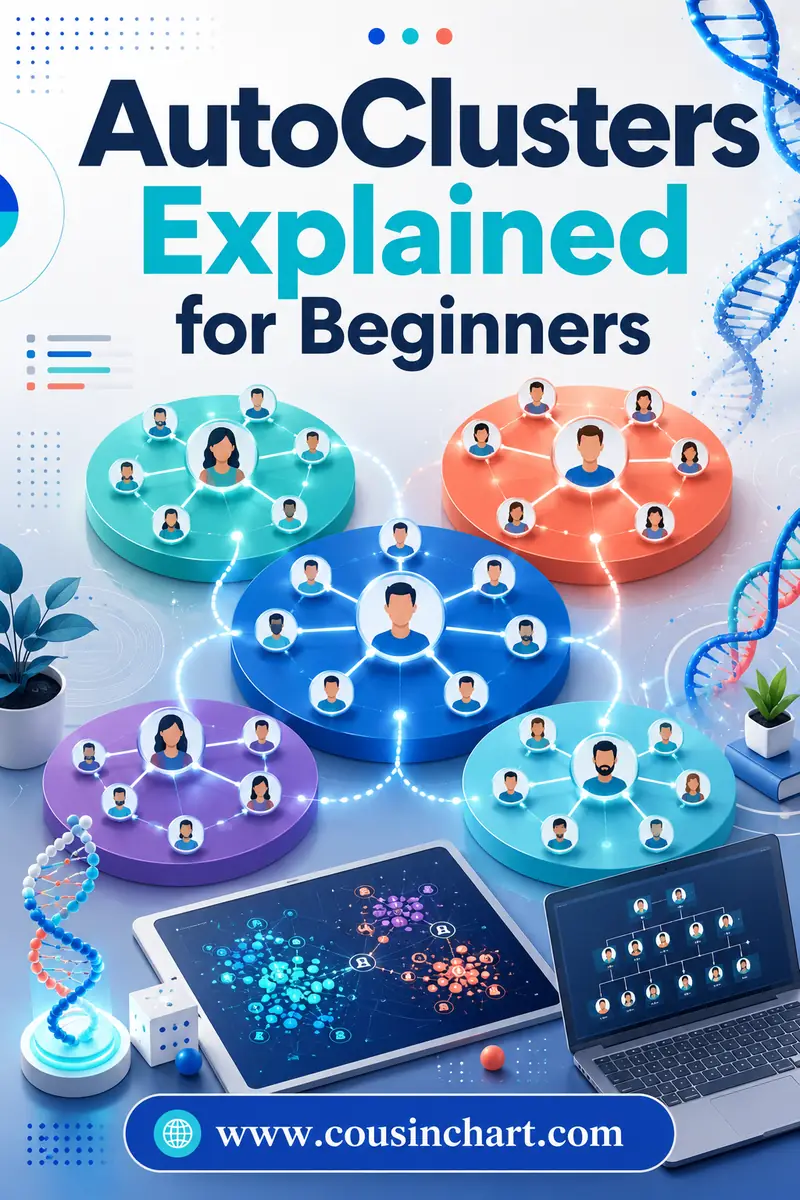
AutoClusters is automated DNA match clustering. Software reads your shared-match lists, works out which of your matches also match each other, and hands back a colored grid where each block of color is a group of people who almost certainly descend from the same ancestral couple. It's the machine version of the manual Leeds Method — same logic, done in minutes instead of an evening.
You can get AutoClusters built into MyHeritage at no extra cost, and through Genetic Affairs, the independent service that invented the tool. AncestryDNA does not offer AutoClusters natively, which surprises a lot of people given it's the biggest database. Before you run a report, it helps to know what the centimorgan numbers on your match list actually mean — the free DNA match calculator will translate any shared cM total into the relationships it could represent.
What’s in an AutoCluster report? Tap any part to see what it means:
Tap a part of the report above to see what it means.
What Are AutoClusters?
An AutoCluster report takes a slice of your DNA match list and sorts it into groups of people who all match each other as well as matching you.
That "as well as" is the whole idea. If Susan and David both match you, that tells you nothing about whether they're on the same side of your family. But if Susan and David also match each other, the simplest explanation is that all three of you inherited DNA from one shared ancestral couple. Do that comparison across a few hundred matches and natural groupings fall out of the data.
The output is a grid. Your matches run down the left edge and across the top in the same order, and the software rearranges that order so the connected people sit next to each other. The result is a staircase of colored squares running diagonally down the image — each square a cluster, each cluster a branch of your family.
Who made AutoClusters?
The tool was developed by Genetic Affairs, a service built by Evert-Jan Blom. MyHeritage later added AutoClusters directly into its DNA section, so MyHeritage testers get a version of it without going anywhere else.
The name gets used loosely now. People say "autoclusters" the way they say "hoover" — meaning any automated clustering report, whoever built it. In practice you'll meet the term at MyHeritage, at Genetic Affairs, and in the various clustering features other sites and tools have added since.
What a cluster actually represents
A cluster is a set of matches who share one ancestral couple with you. It is not a labeled branch. The software has no idea who your ancestors were — it only knows who shares DNA with whom.
So a finished report says "these fourteen people belong together." It doesn't say "these fourteen people are your maternal grandmother's Kowalski line." Putting a name on a cluster is your job, and it's the step where the real genealogy happens.
Where Can You Get AutoClusters?
Access depends entirely on where you tested, and this is the part that trips people up.
| Where you tested | AutoClusters available? | How |
|---|---|---|
| MyHeritage DNA | Yes, built in | Free in the DNA Tools section of your account |
| AncestryDNA | Not natively | Ancestry offers no clustering report of its own |
| 23andMe | Not natively | Via third-party services where access allows |
| FamilyTreeDNA | Not natively | Via third-party services where access allows |
| GEDmatch | Clustering tools offered separately | Within GEDmatch's own toolset |
MyHeritage is the easy answer. If you've tested there or uploaded a raw DNA file there, AutoClusters sits in the DNA Tools menu, runs in a few minutes, and emails you the report. There's no extra charge for it.
Genetic Affairs is the specialist option. It runs clustering across several databases and adds features MyHeritage doesn't have, including reports that build automatic trees from your matches' trees. It works on a credit system rather than being free.
AncestryDNA users have to work around it. Ancestry doesn't provide clustering, and third-party access to Ancestry match data has been restricted at various points, so don't assume any given tool can reach your Ancestry list today. The dependable workaround is the manual Leeds Method, which needs nothing except a spreadsheet and the shared-match feature Ancestry already gives you. The other option is to download your raw Ancestry data and upload it free to MyHeritage, where you'll get a new match list and AutoClusters — though those will be MyHeritage matches, not your Ancestry ones.
Does uploading elsewhere actually help?
Often, yes. Raw-data uploads to MyHeritage and FamilyTreeDNA are free or cheap, and they put your kit in front of a different pool of testers. You lose nothing, and you gain a database where clustering is available.
What you don't get is a magic view of your Ancestry matches. Every company only clusters the people in its own database. If your best matches all tested at Ancestry, an upload elsewhere won't reveal them.
How Do AutoClusters Actually Work?
The mechanics are simpler than the polished output suggests.
- Pull the match list within the cM range you specified.
- Fetch each person's shared-match list — the people who match both you and them.
- Build a matrix. Every match gets a row and a column. Mark a cell where two matches share DNA with each other.
- Reorder the matrix so densely connected people end up adjacent, using a clustering algorithm.
- Color the dense blocks and output the image plus a spreadsheet.
That's it. No segment analysis, no chromosome data, no tree reading. It's all built from the same shared-match lists you can click through yourself — the software is just far more patient than you are.
Why it doesn't need a chromosome browser
Clustering asks "do these two people share DNA?" and nothing more. It never asks where on the genome they share it. That's why AutoClusters works on sites with no chromosome browser and why it's usable by people who find segment data intimidating.
The trade-off is precision. Segment-based methods can prove that three people share the same physical stretch of DNA inherited from a specific ancestor. Clustering can only say these people group together. It's a coarser tool, but it's available to everyone and it's fast.
How Do You Read a Cluster Grid?
Open the report and you'll see a square image with names on two edges and color running down the diagonal.
Read along the diagonal. Each colored block is one cluster. The people whose names fall inside that block belong to that group.
Look at the gray cells. Gray squares appear outside the colored blocks, marking people who also match members of a different cluster. A handful of gray cells between two clusters is normal and interesting — it usually means those two clusters are related branches, often descending from the same more distant couple.
Notice the empty space. Blank cells mean two matches don't share DNA with each other. Most of the grid should be blank. A grid with very little blank space is a warning sign, and it usually means endogamy.
Notice the sizes. A cluster of thirty people means that branch of your family tested heavily. A cluster of three means barely anyone from that line has tested. Both facts are useful — the small clusters tell you where a targeted test of an older relative would pay off most.
The spreadsheet matters more than the picture
The grid image is what everyone shares on social media, but the attached spreadsheet is where the work happens. It lists each match with their cluster number, shared cM, and often their tree size and any notes you've saved on the site.
Sort that sheet by cluster and you have a workable to-do list: for each cluster, find the one or two people with a readable tree, identify the common surnames and places, and label the whole group.
Putting names on your clusters
This is the payoff, and the method is always the same:
- Open the trees of everyone in a cluster who has one.
- Look for a surname, a place, or a couple that repeats.
- Check that repeated couple against your own tree.
- Once you've identified the shared ancestors, that label applies to every match in the cluster — including the people with no tree, private trees and unhelpful usernames.
One readable tree can identify twenty anonymous matches. That's why clustering is worth the setup.
What cM Window Should You Use?
Clustering runs on a slice of your match list, not all of it, and the slice you choose decides what the report looks like.
A window of roughly 50 to 350 cM is the common default, and it's a sensible starting point. Here's why each end matters.
The upper limit keeps close relatives out. A first cousin, half sibling, aunt or uncle descends from a couple who sit at the top of two of your grandparent lines, so they match people across multiple clusters and bond those clusters into a single lump. Leave them out and the separation stays clean.
The lower limit keeps the report finishable. Drop the floor to 20 cM and you may pull in thousands of matches, each needing its own shared-match lookup. Reports get enormous, run times get long, and the connections at that level are noisy enough that clusters lose meaning.
Adjusting the window when results disappoint
| Problem | Try this |
|---|---|
| Only two or three clusters | Lower the floor to 30–40 cM to pull in more people |
| One giant merged cluster | Raise the floor to 80–100 cM and lower the ceiling |
| Dozens of tiny two-person clusters | Raise the floor; you're capturing distant noise |
| A branch you know about is missing | That family may simply not have tested |
| Report takes forever or fails | Narrow the window and try again |
Run the report more than once with different settings. There's no single correct window, and comparing two runs often teaches you more than either one alone.
AutoClusters vs the Leeds Method: What's the Difference?
They use identical logic. The differences are in effort, granularity, and how much you learn along the way.
| AutoClusters | Leeds Method | |
|---|---|---|
| How it runs | Software does it | You do it by hand in a spreadsheet |
| Time needed | Minutes | An hour or two |
| Typical cM window | ~50–350 cM | ~90–400 cM |
| Number of clusters | Often ten to thirty | Usually four |
| What a cluster means | One ancestral couple, often great-grandparents or further back | One grandparent's line |
| Works with AncestryDNA | Not natively | Yes — its main advantage |
| Cost | Free at MyHeritage; credit-based at Genetic Affairs | Free |
| Understanding gained | Lower — you receive a finished picture | Higher — you watch every connection form |
| Handles endogamy | Poorly | Poorly |
The practical difference is grain. The Leeds Method deliberately aims at the grandparent level and gives you four big buckets. AutoClusters usually slices finer and gives you many smaller groups pointing at more distant ancestral couples.
Most experienced researchers use both, in that order: run the Leeds Method by hand once so you understand the shape of your own match list, then use AutoClusters for the detail work. If you test at Ancestry, the manual method isn't optional — it's the only one you've got.
Why Do AutoClusters Struggle With Endogamy?
Because clustering assumes that if two of your matches share DNA, they share it through one line. In an endogamous population, that assumption collapses.
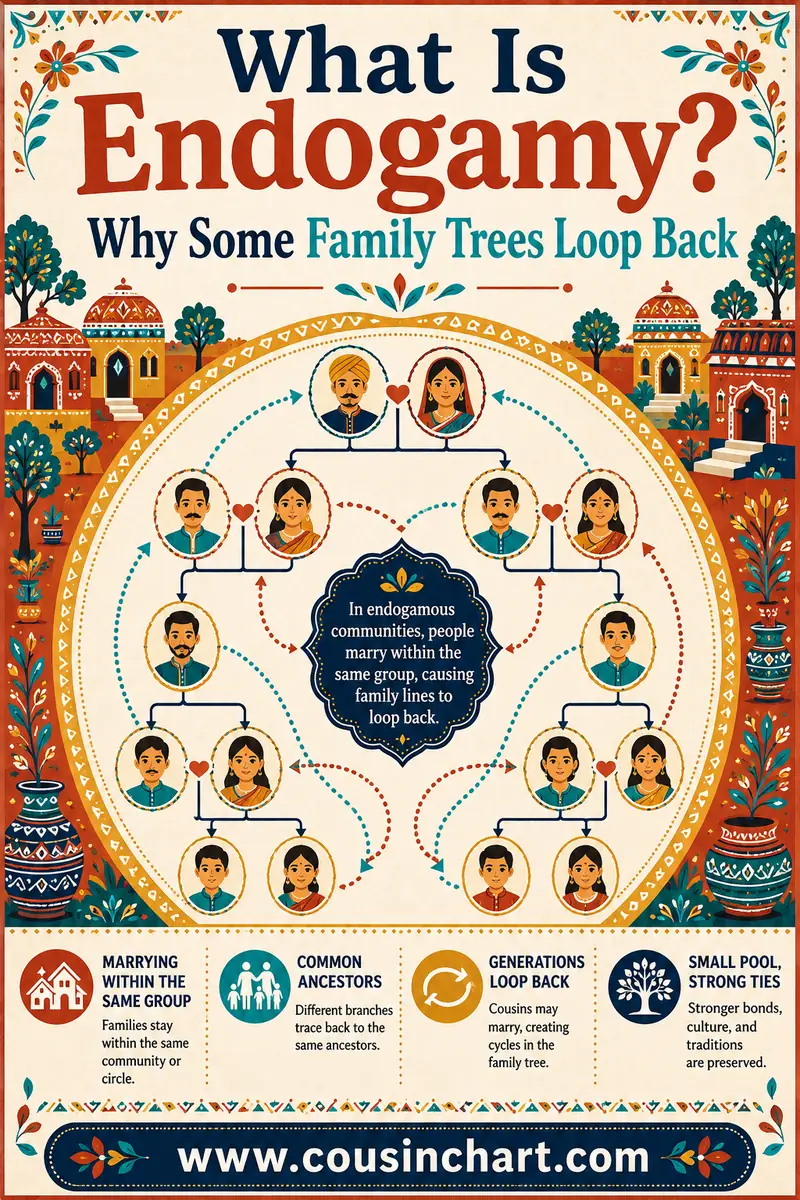
Endogamy means descent from a community where people married within the same group for many generations — Ashkenazi Jewish, Acadian, Low German Mennonite, Puerto Rican, and many island and isolated-valley populations, among others. After enough generations of that, everyone in the community is related to everyone else through dozens of overlapping paths.
Feed that into a clustering algorithm and you get one of two failures:
- The blob. A single enormous cluster containing most of your matches, because they genuinely all match each other. Technically correct, practically useless.
- The gray wash. Clusters do form, but the space between them is so full of gray cells that the boundaries mean nothing.
What to do if that's your result
- Raise the floor hard. Working from 150 cM or higher cuts a lot of the multi-path noise, at the cost of a much shorter list.
- Narrow the ceiling too. A tight window like 150–300 cM sometimes produces usable structure where a wide one doesn't.
- Treat clusters as regions, not lines. A cluster may point at a village or a congregation rather than a specific couple.
- Lean on records. In endogamous populations, documented genealogy does the work DNA can't. Parish registers and civil records will get you further than another clustering run.
- Don't trust the cM numbers at face value. Shared totals run high in these populations, so a match that looks like a second cousin may be a fourth cousin related several ways. The shared cM chart guide explains why the ranges are so wide.
Being honest about it: if you have endogamy on one side and not the other, clustering will work well on one half of your family and barely at all on the other. That's normal, and it's worth knowing before you blame the tool.
What Can AutoClusters Tell You — and What Can't They?
They can tell you:
- Which of your matches belong together.
- Roughly how many distinct branches are represented in your match list.
- Which branches are heavily tested and which are nearly absent.
- Where a brand-new match fits, in seconds, once your clusters are labeled.
- That something unexpected exists — a cluster full of surnames nobody in your family recognises.
They can't tell you:
- Who the shared ancestor is. Only trees and records answer that.
- Which side of your family a cluster belongs to, until you identify one person in it.
- How you're related to any individual match.
- Anything reliable when endogamy is heavy.
- Whether a small cluster is a real branch or three people who happen to share a distant connection.
That first "can't" is the one to hold onto. Clusters tell you who groups together, not how you're related. The report is the beginning of the research, not the answer. Confirming an actual relationship still means comparing trees and records — our guide to confirming a DNA match walks through what that proof looks like.
What Do You Do With Your Clusters?
Here's a practical order of work once the report lands.
1. Label what you can. Go cluster by cluster looking for readable trees. Name every group you can identify. Expect to name maybe half of them on the first pass.
2. Note the sides. Once a cluster is labeled, you know which of your four grandparent lines it belongs to. Group your clusters by side — it makes everything afterwards faster.
3. Work the unlabelled ones. For a cluster with no trees at all, look at the surnames in usernames, the locations in profiles, and any notes you've saved. Sometimes one message to the right person unlocks the group.
4. Add the clusters to your notes on the site. Most testing sites let you tag or note individual matches. Recording "Cluster 7 — Brennan line" against each name means you never have to re-derive it.
5. Re-run in six months. New matches arrive constantly. A fresh report will place them into existing clusters automatically, and occasionally a new tester will crack a cluster that's been anonymous for a year.
6. Use the clusters on new matches. The lasting value isn't the report — it's that every future match can be sorted in thirty seconds by checking which cluster their shared matches sit in. If you're still getting your bearings with your match list generally, our guide to DNA matches covers what all the numbers and labels mean.
FAQ
What are AutoClusters in DNA testing?
AutoClusters are automatically generated groups of your DNA matches, arranged so that everyone in a group matches you and matches each other. Each cluster usually represents descendants of one ancestral couple. The report comes as a colored grid plus a spreadsheet listing every match and its cluster number.
Does AncestryDNA have AutoClusters?
No. AncestryDNA does not offer AutoClusters or any built-in clustering report, and third-party access to Ancestry match data has been limited at various times. Ancestry testers usually use the manual Leeds Method instead, or upload their raw DNA file to MyHeritage where clustering is included free.
What cM range should I use for AutoClusters?
Roughly 50 to 350 cM works for most people. The upper limit keeps first cousins and closer relatives out, since they bridge multiple clusters and merge them. The lower limit keeps the report from ballooning into thousands of noisy distant matches. Adjust in both directions if your first run looks wrong.
Why do my AutoClusters all merge into one big cluster?
Almost always endogamy — ancestry from a community where people married within the same population for generations, so nearly everyone matches nearly everyone. Raising your minimum cM sharply, to 150 or higher, sometimes recovers structure. Otherwise, documented records will serve you better than clustering for those lines.
Do AutoClusters tell me how I'm related to a match?
No. Clustering only shows that a group of people share DNA with you and with each other. It doesn't identify the shared ancestor or the relationship. You work that out by comparing the trees of people in the cluster and looking for a couple that repeats.
Are AutoClusters better than the Leeds Method?
They're faster and finer-grained, but not strictly better. AutoClusters produce many small clusters in minutes; the Leeds Method produces about four grandparent-level groups and teaches you far more about your own match list. The Leeds Method also works at AncestryDNA, where AutoClusters aren't available.
Let the Software Do the Clicking
AutoClusters take the single most tedious job in genetic genealogy — opening hundreds of shared-match lists — and finish it while you make coffee. What comes back isn't an answer, but it is a map: a set of groups, each one a real branch of your family, waiting for a name.
Start by getting comfortable with the numbers the clustering runs on. Drop a few of your matches into the free DNA match calculator to see what each cM total could mean, then read the shared cM chart guide to understand why those ranges overlap so much. Once the numbers make sense, the clusters will too.